Private Credit Crisis Erupts—Can It Land Safely?
Private Credit Crisis Erupts—Can It Land Safely?
On Monday, April 6, 2026, shares of Blue Owl Capital (OWL), a leading U.S. private credit asset manager, closed at $8.45, marking a new all-time low on the weekly chart since its public listing, with intraday lows reaching $7.80. The trigger for this round of selling was data released by Blue Owl the previous Thursday regarding redemption requests from its semi-liquid BDC funds for Q1. Two of its flagship non-traded BDCs—OTIC (Blue Owl Technology Income) and OCIC (Blue Owl Credit Income)—received cumulative redemption requests totaling approximately $5.4 billion in the quarter. OTIC’s redemption rate reached 40.7% of outstanding shares, while OCIC hit 21.9%, both triggering the industry’s hard 5% quarterly redemption gate. As a result, only about $1.2 billion was approved for payout under proportional allocation.
Mainstream financial media quickly framed this event as the "breakdown of the retail private credit narrative" and the "spillover of AI disruption from software firms to creditors." However, these labels obscure a more critical fact: during the same week, Goldman Sachs Private Credit Corp, a fund managed by Goldman Sachs Asset Management, saw redemption requests amount to 4.999% of its AUM—just 0.001 percentage point below the 5% threshold. This made it one of the few, possibly the only, large-scale semi-liquid perpetual BDCs to avoid triggering the gate entirely and honor full redemptions. This redemption wave was not a collapse of private credit broadly, but a clear case of K-shaped divergence.
According to a Bloomberg report dated April 6, Goldman Sachs’ $15.7 billion fund stood out as the sole exception that “Dodged the Exodus” in the quarter. Meanwhile, OTIC’s redemption rate was 8.1 times higher than Goldman’s, and OCIC’s was 4.4 times higher. While market attention focused solely on Blue Owl’s plunge, the real question worth probing is why two institutions with identical structures, operating within the same week and subject to the same 5% gate, ended up with such drastically different outcomes.
Stock Price Down Three-Quarters Over 15 Months
First, let’s examine how the market has priced Blue Owl. According to Yahoo Finance historical weekly data, Blue Owl Capital (OWL) closed at $25.02 on the week of January 20, 2025—a record high. By the week ending April 6, 2026, it had plummeted to $8.45, losing 66.2% over 15 months and erasing nearly two-thirds of its market capitalization.
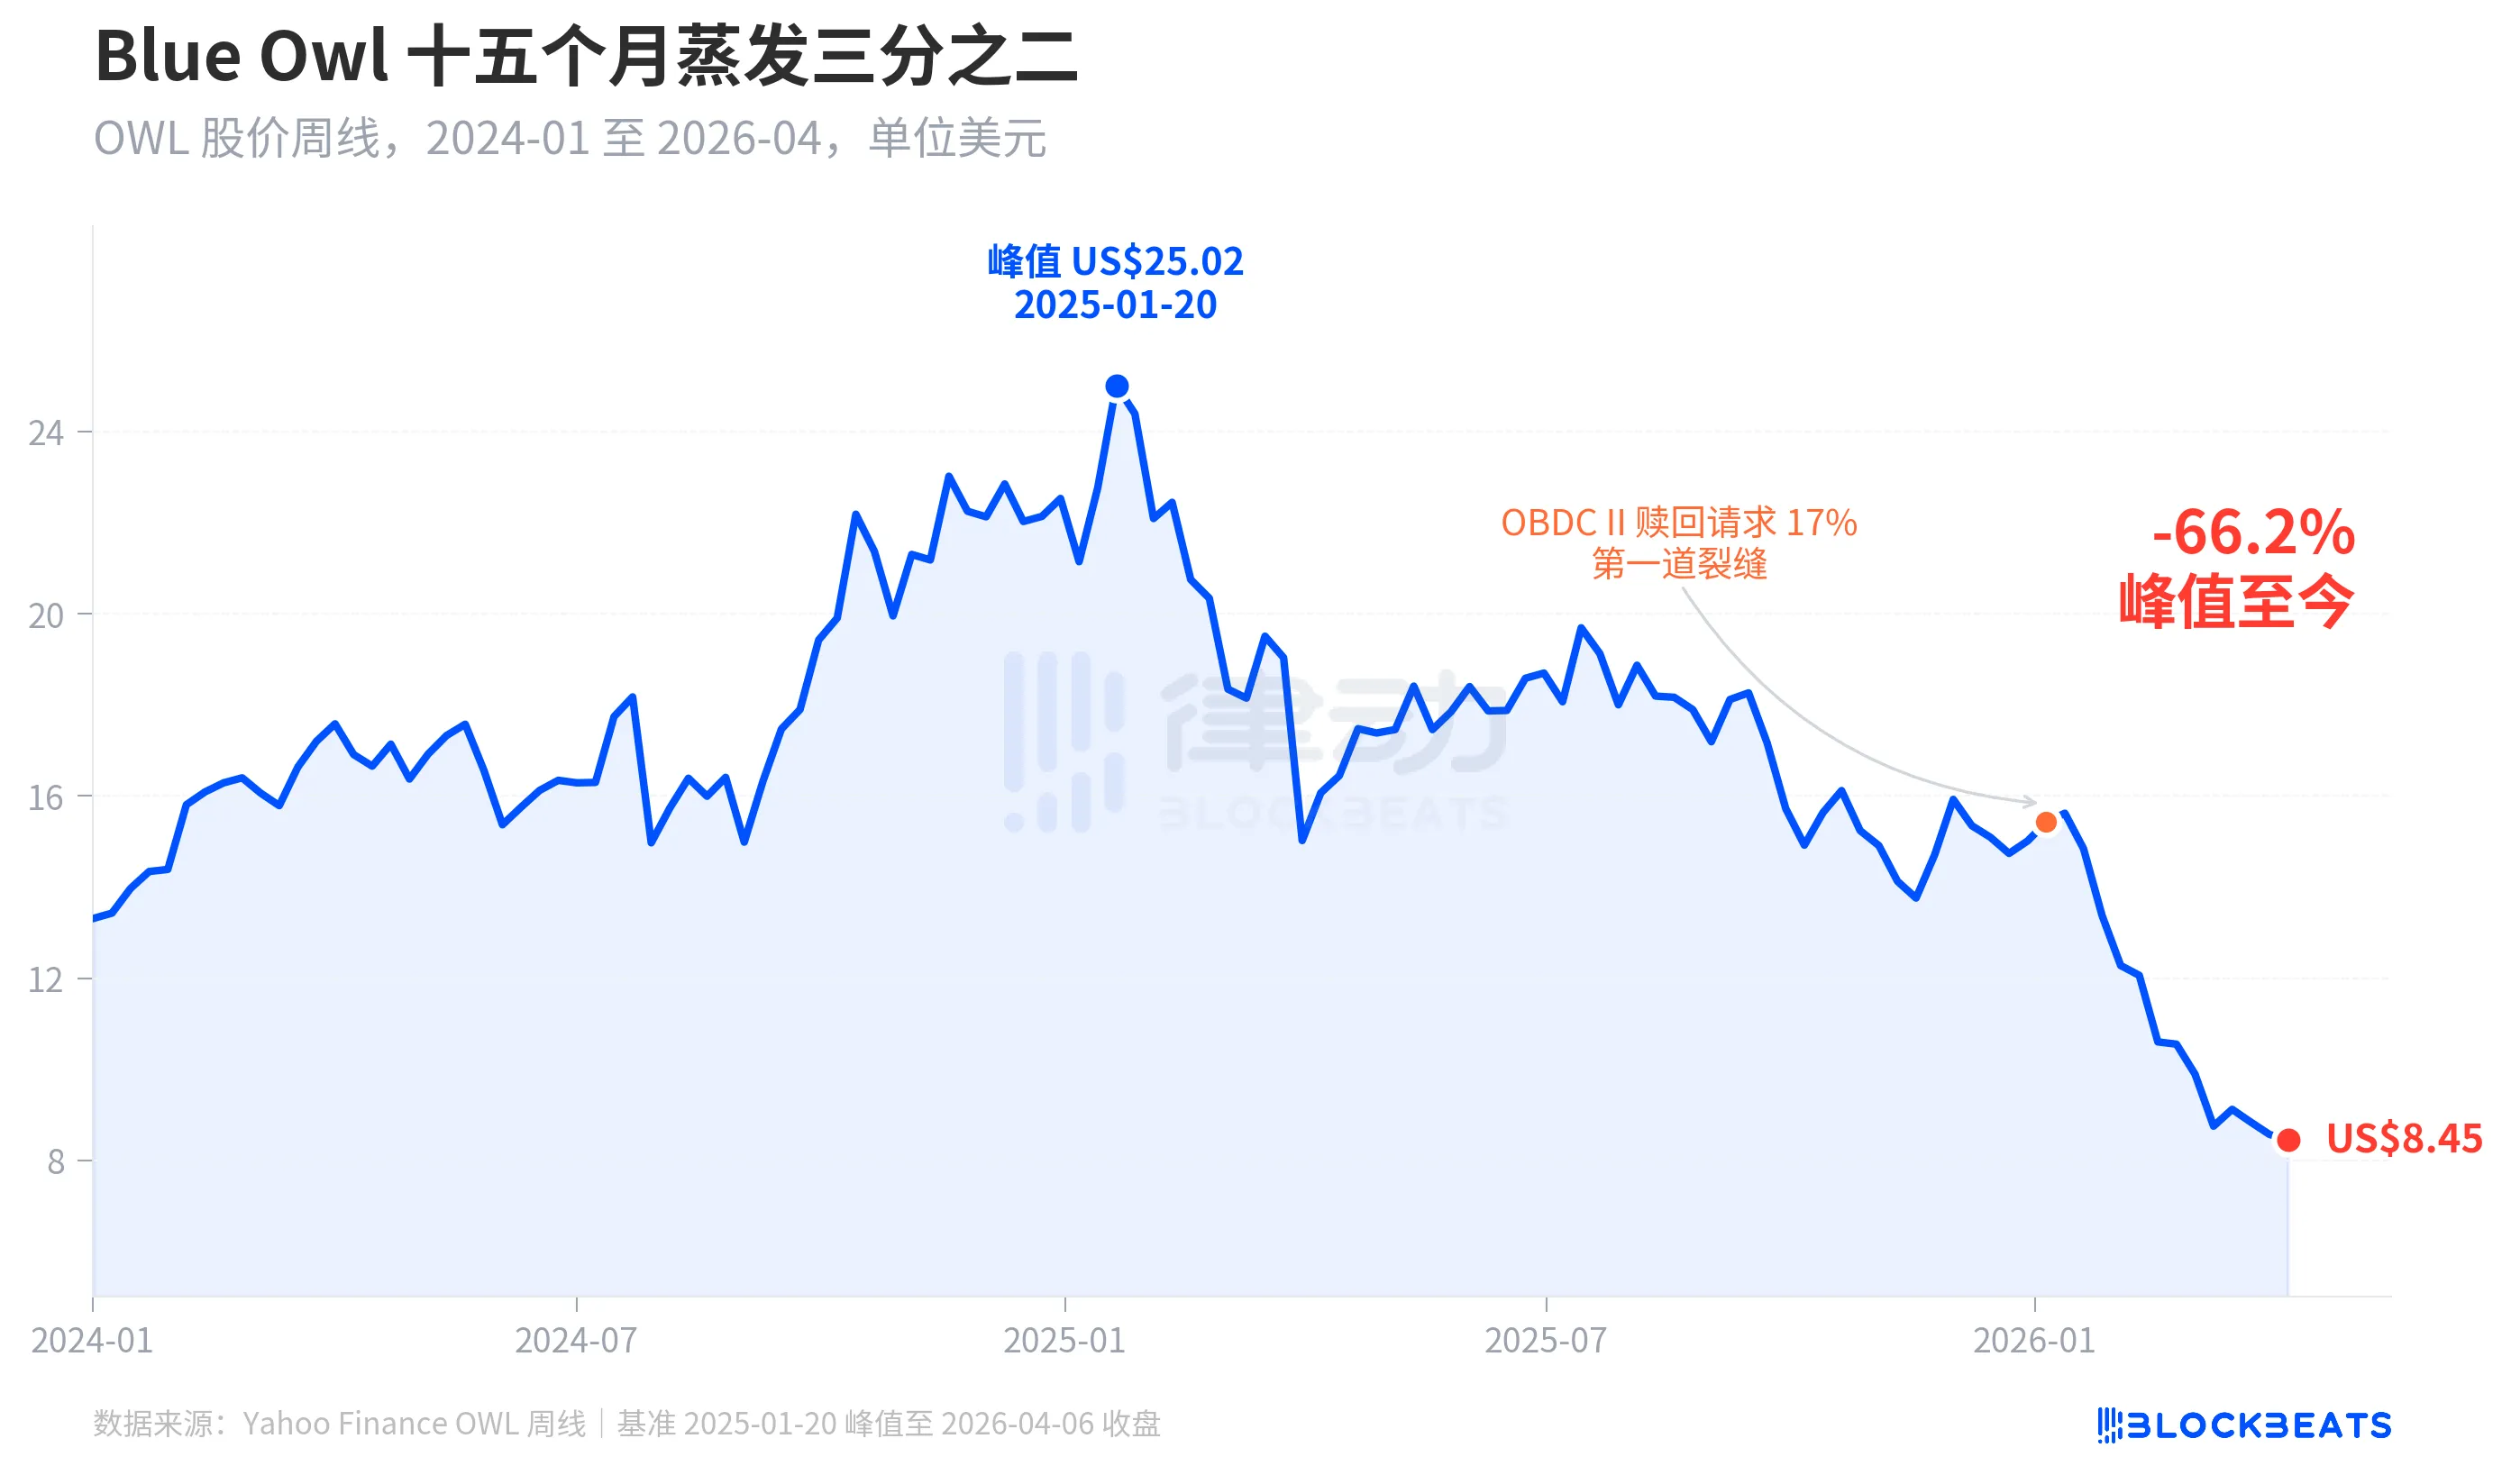
The first visible crack in the stock occurred in early January 2026, when Blue Owl’s OBDC II—a smaller, non-public BDC—disclosed redemption requests equivalent to 17% of its outstanding shares. This was widely seen as the “first fissure.” Since then, the stock trended downward, culminating in Q1’s end when both OTIC and OCIC triggered their gates, sending the share price down to an intraday low of $7.80—the lowest level since IPO.
Notably, Blue Owl’s stock decline (-66.2%) significantly outpaced the deterioration in its fundamentals. OCIC still maintains $36 billion in AUM, with net asset value declining by approximately 6.5% in Q1 2026, and the company’s total managed assets remain above $290 billion. The market appears to be pricing in two factors beyond current performance: “future redemption uncertainty” and “collapse of valuation confidence,” rather than just near-term earnings.
Same Gate, Two Fates
The clearest illustration of K-shaped divergence comes from cross-sectional analysis. When examining the five major semi-liquid perpetual BDCs that publicly disclosed redemption data for Q1 2026, the structural differences become immediately apparent.
Per Bloomberg, CNBC, and fund filings, the redemption rates were: Blue Owl OTIC at 40.7%, Blue Owl OCIC at 21.9%, Apollo Debt Solutions at 11.2%, Morgan Stanley North Haven Private Income Fund at 10.9%, and Goldman Sachs Private Credit Corp at 4.999%. These five funds can be broadly categorized into three tiers.
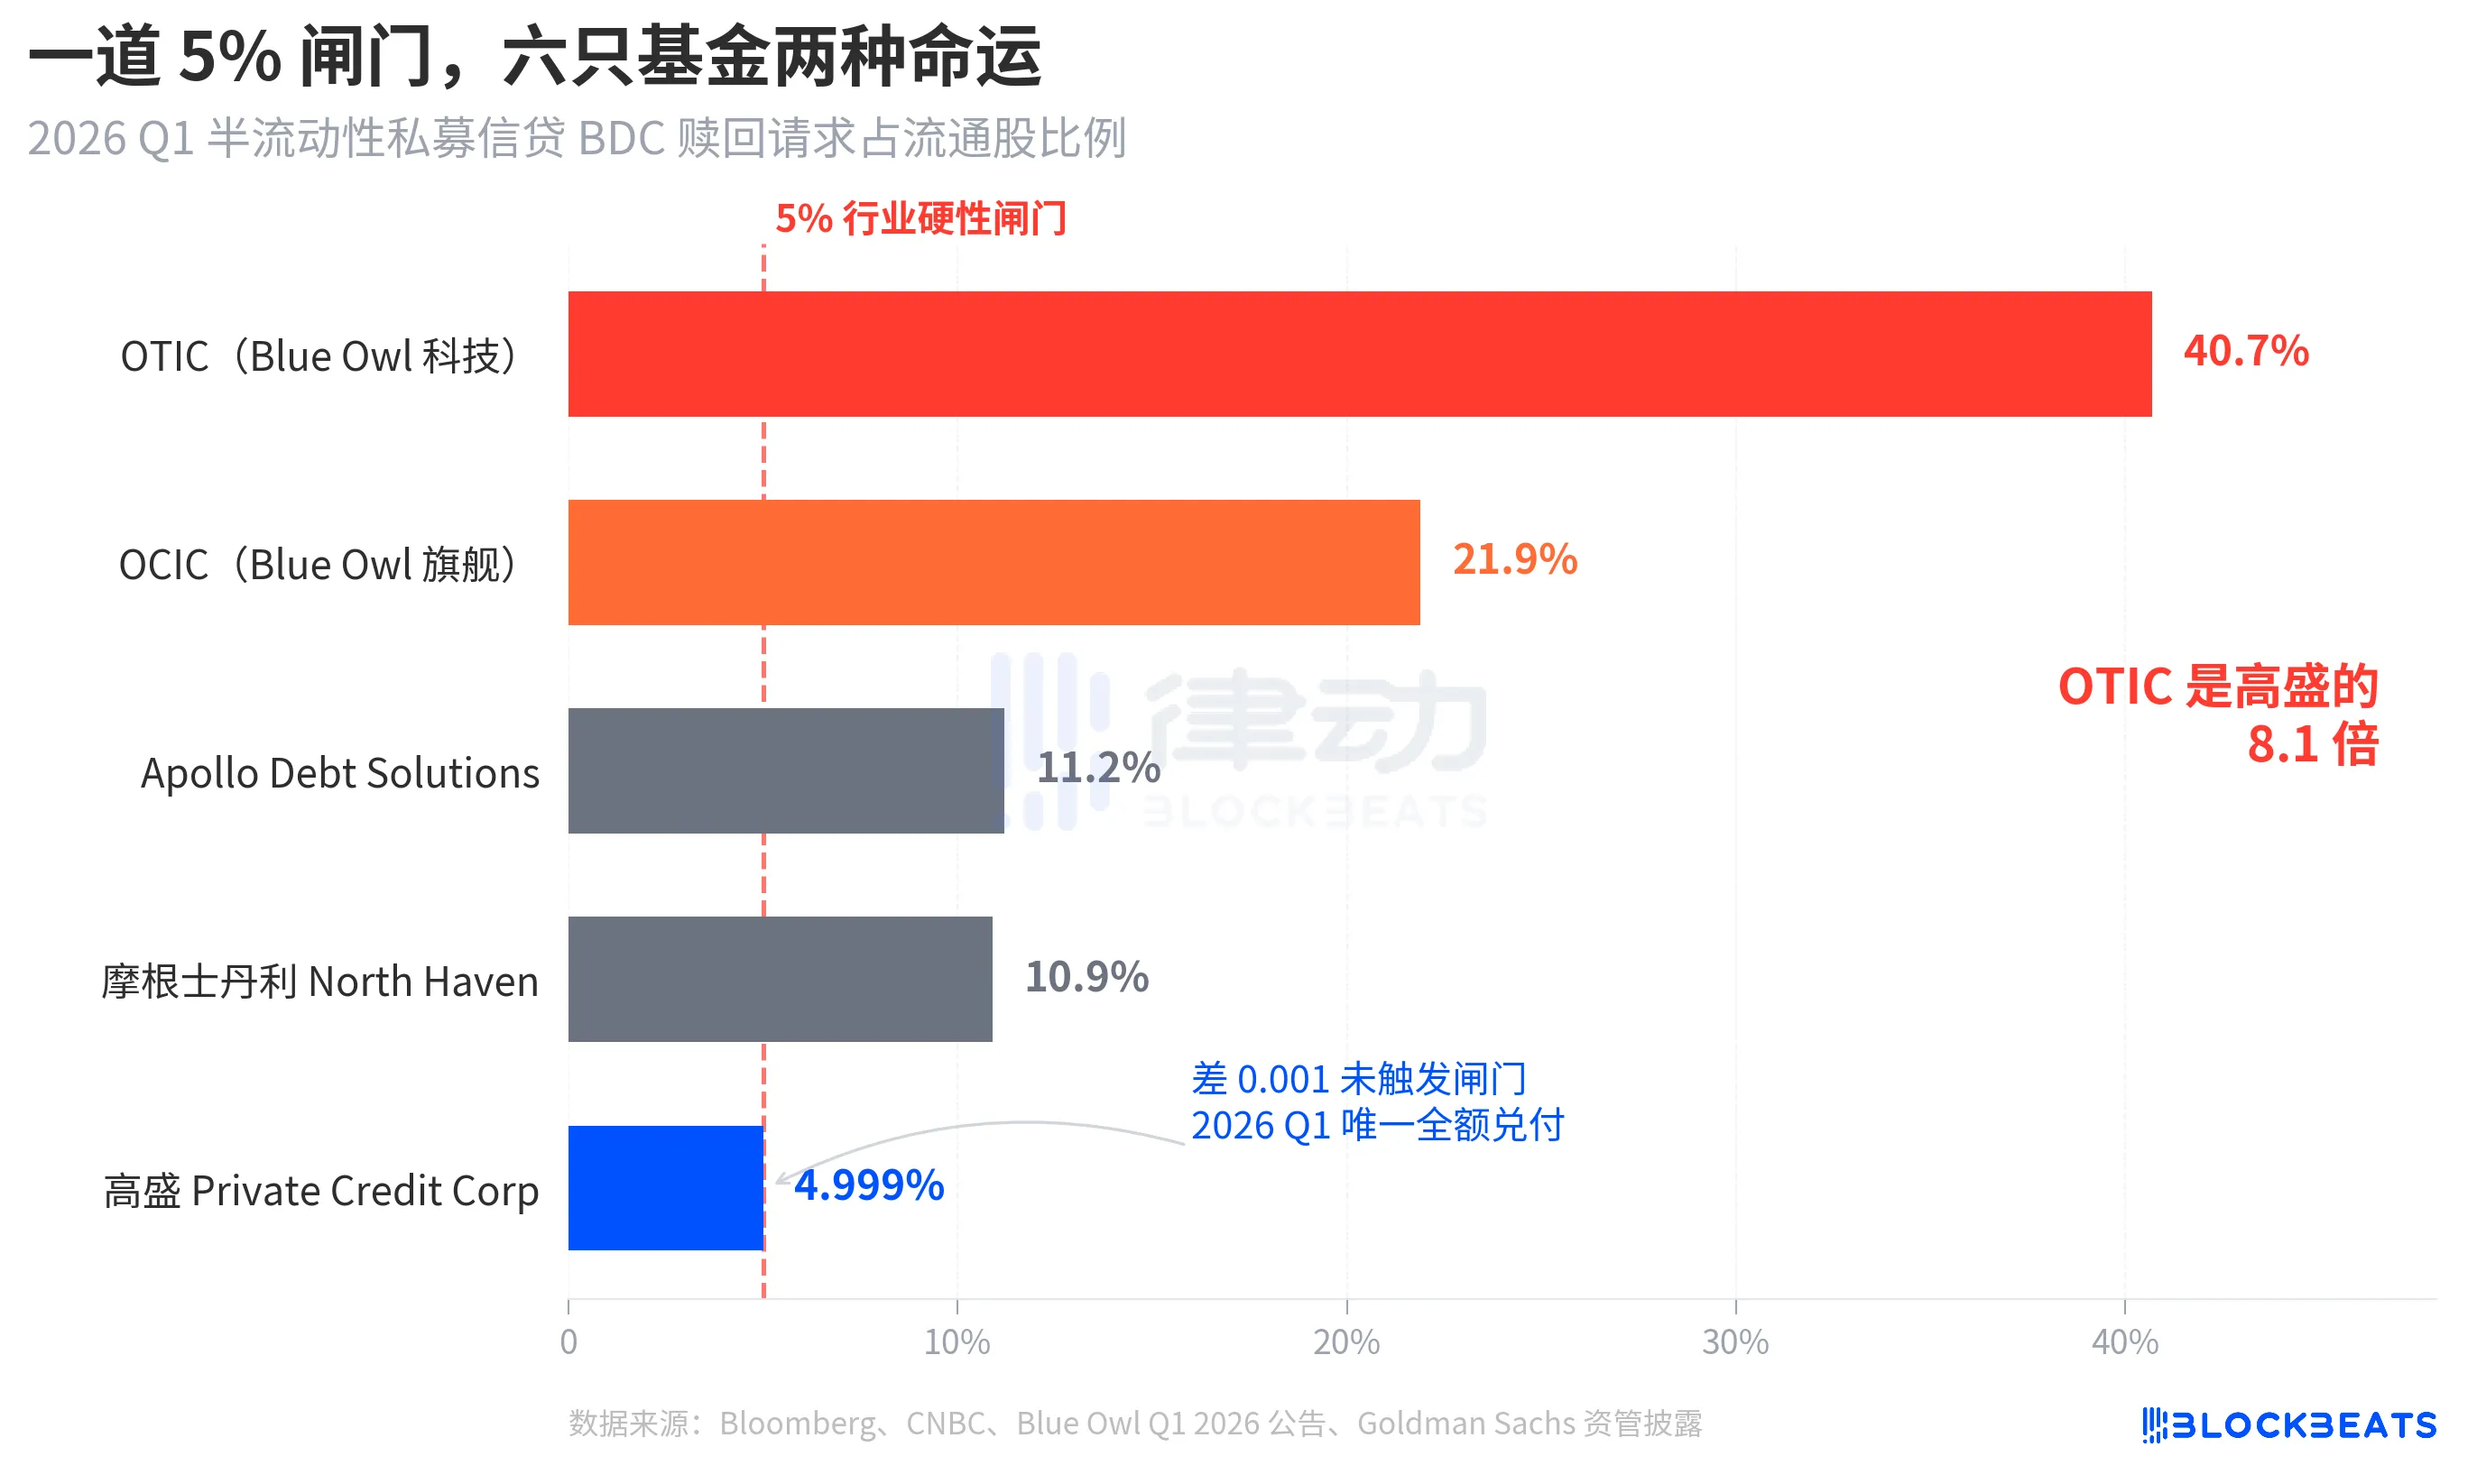
Top tier: Both Blue Owl funds far exceeded the gate. OTIC saw nearly half its investors exit, while OCIC approached four times the threshold. Under the rules, no more than 5% of outstanding shares could be redeemed. OTIC thus processed only ~$179 million in redemptions, and OCIC paid out ~$988 million. Over $4.2 billion in redemption requests remained locked behind the gate.
Middle tier: Apollo and Morgan Stanley posted redemption rates between 10% and 11%. According to Bloomberg reports from March 11 and March 23, Apollo Debt Solutions honored ~45% of requests, and North Haven paid ~46%. Per PitchBook and iCapital industry guidelines, both funds triggered the gate but faced markedly less pressure than Blue Owl.
Bottom tier: Only Goldman Sachs. At 4.999%, it was the only large fund in the cohort to avoid the 5% gate entirely, processing 100% of redemption requests without restriction.
Bloomberg’s article title used “Dodges Exodus”—and the fact that OTIC’s redemption rate was 8.1 times higher than Goldman’s speaks volumes about the intensity of the divergence. Same week, same structure, same rulebook, yet two institutions experienced completely different fates.
Bubble, Retail Investors Lifted It 4.4x
To understand why this redemption surge hit so hard, we must first assess how deep the inflows were. According to Robert A. Stanger & Co.’s industry data, annual fundraising for non-traded BDCs in the U.S. followed a clear parabolic trajectory over the past five years.
In 2021, total annual fundraising stood at $14.3 billion; by 2025, it reached a record $63 billion—fourfold growth over five years. The same report shows that the top five firms—Blackstone, Blue Owl, Apollo, Ares, and HPS—captured roughly 83% of the total, or ~$52.3 billion, concentrated among the industry’s largest players. The influx of retail capital over the past five years was not only massive in scale but also extremely concentrated.
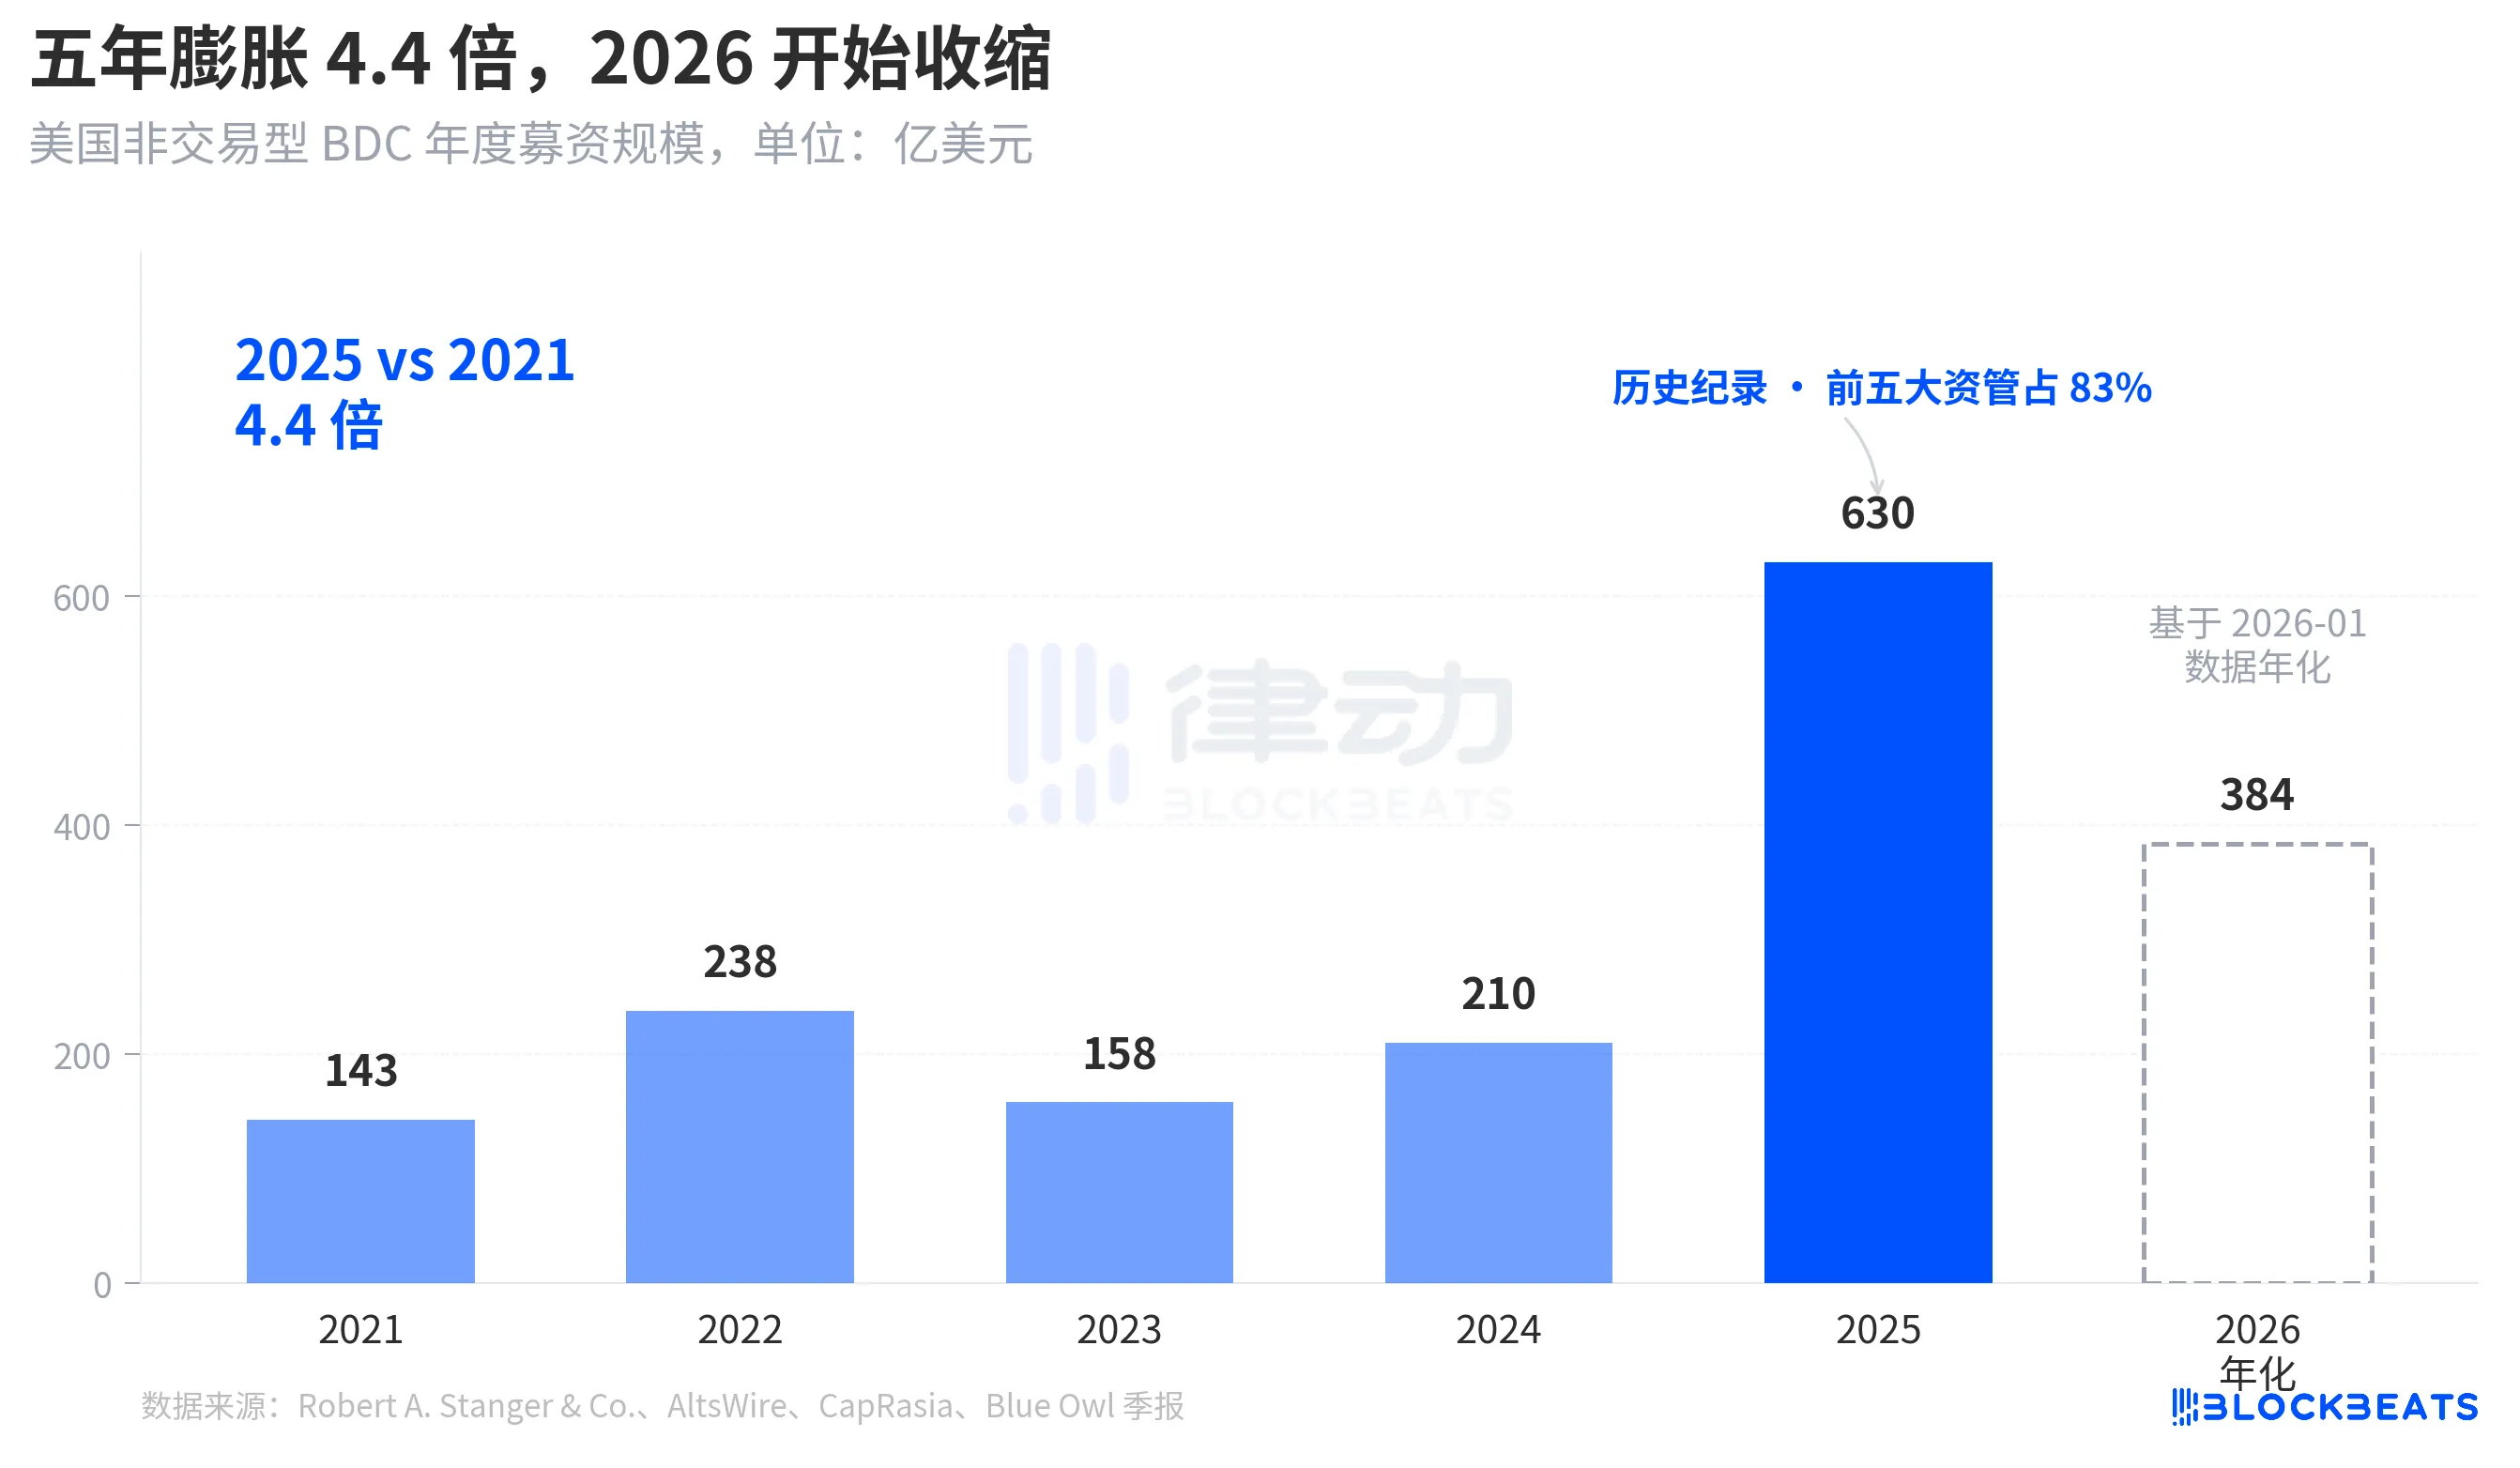
Yet by January 2026, Stanger’s monthly data showed non-traded BDC fundraising had dropped to just $3.2 billion—nearly halved from the peak of $6.2 billion in March 2025. According to Connect Money and FinancialContent reports, overall BDC sales declined by approximately 40% year-over-year in Q1 2026. In the very quarter where redemptions began to concentrate, new inflows were visibly decelerating. The simultaneous rise in redemption pressure and drop in new subscriptions meant the gate was being pressed harder than anyone anticipated.
This was not a cyclical correction—it marked the first time the narrative of semi-liquid perpetual BDCs as “near-savings products” sold to retail investors was re-examined at the capital level.
From BREIT to Blue Owl: Fragility Unveiled Over Four Years
Placing this redemption wave in a longer timeline reveals it was not sudden.
The “semi-liquid perpetual” structure carries two layers of commitment: it allows funds to remain unlisted and non-transparent in valuation, while promising investors quarterly redemptions at NAV. Essentially, it packages illiquid assets—private credit, private real estate—into a product that *appears* redeemable at any time. To prevent runs, the industry standardized a 5% quarterly redemption gate. If redemptions exceed 5% of outstanding shares in a quarter, payouts are allocated proportionally, and remaining requests are deferred to the next quarter.
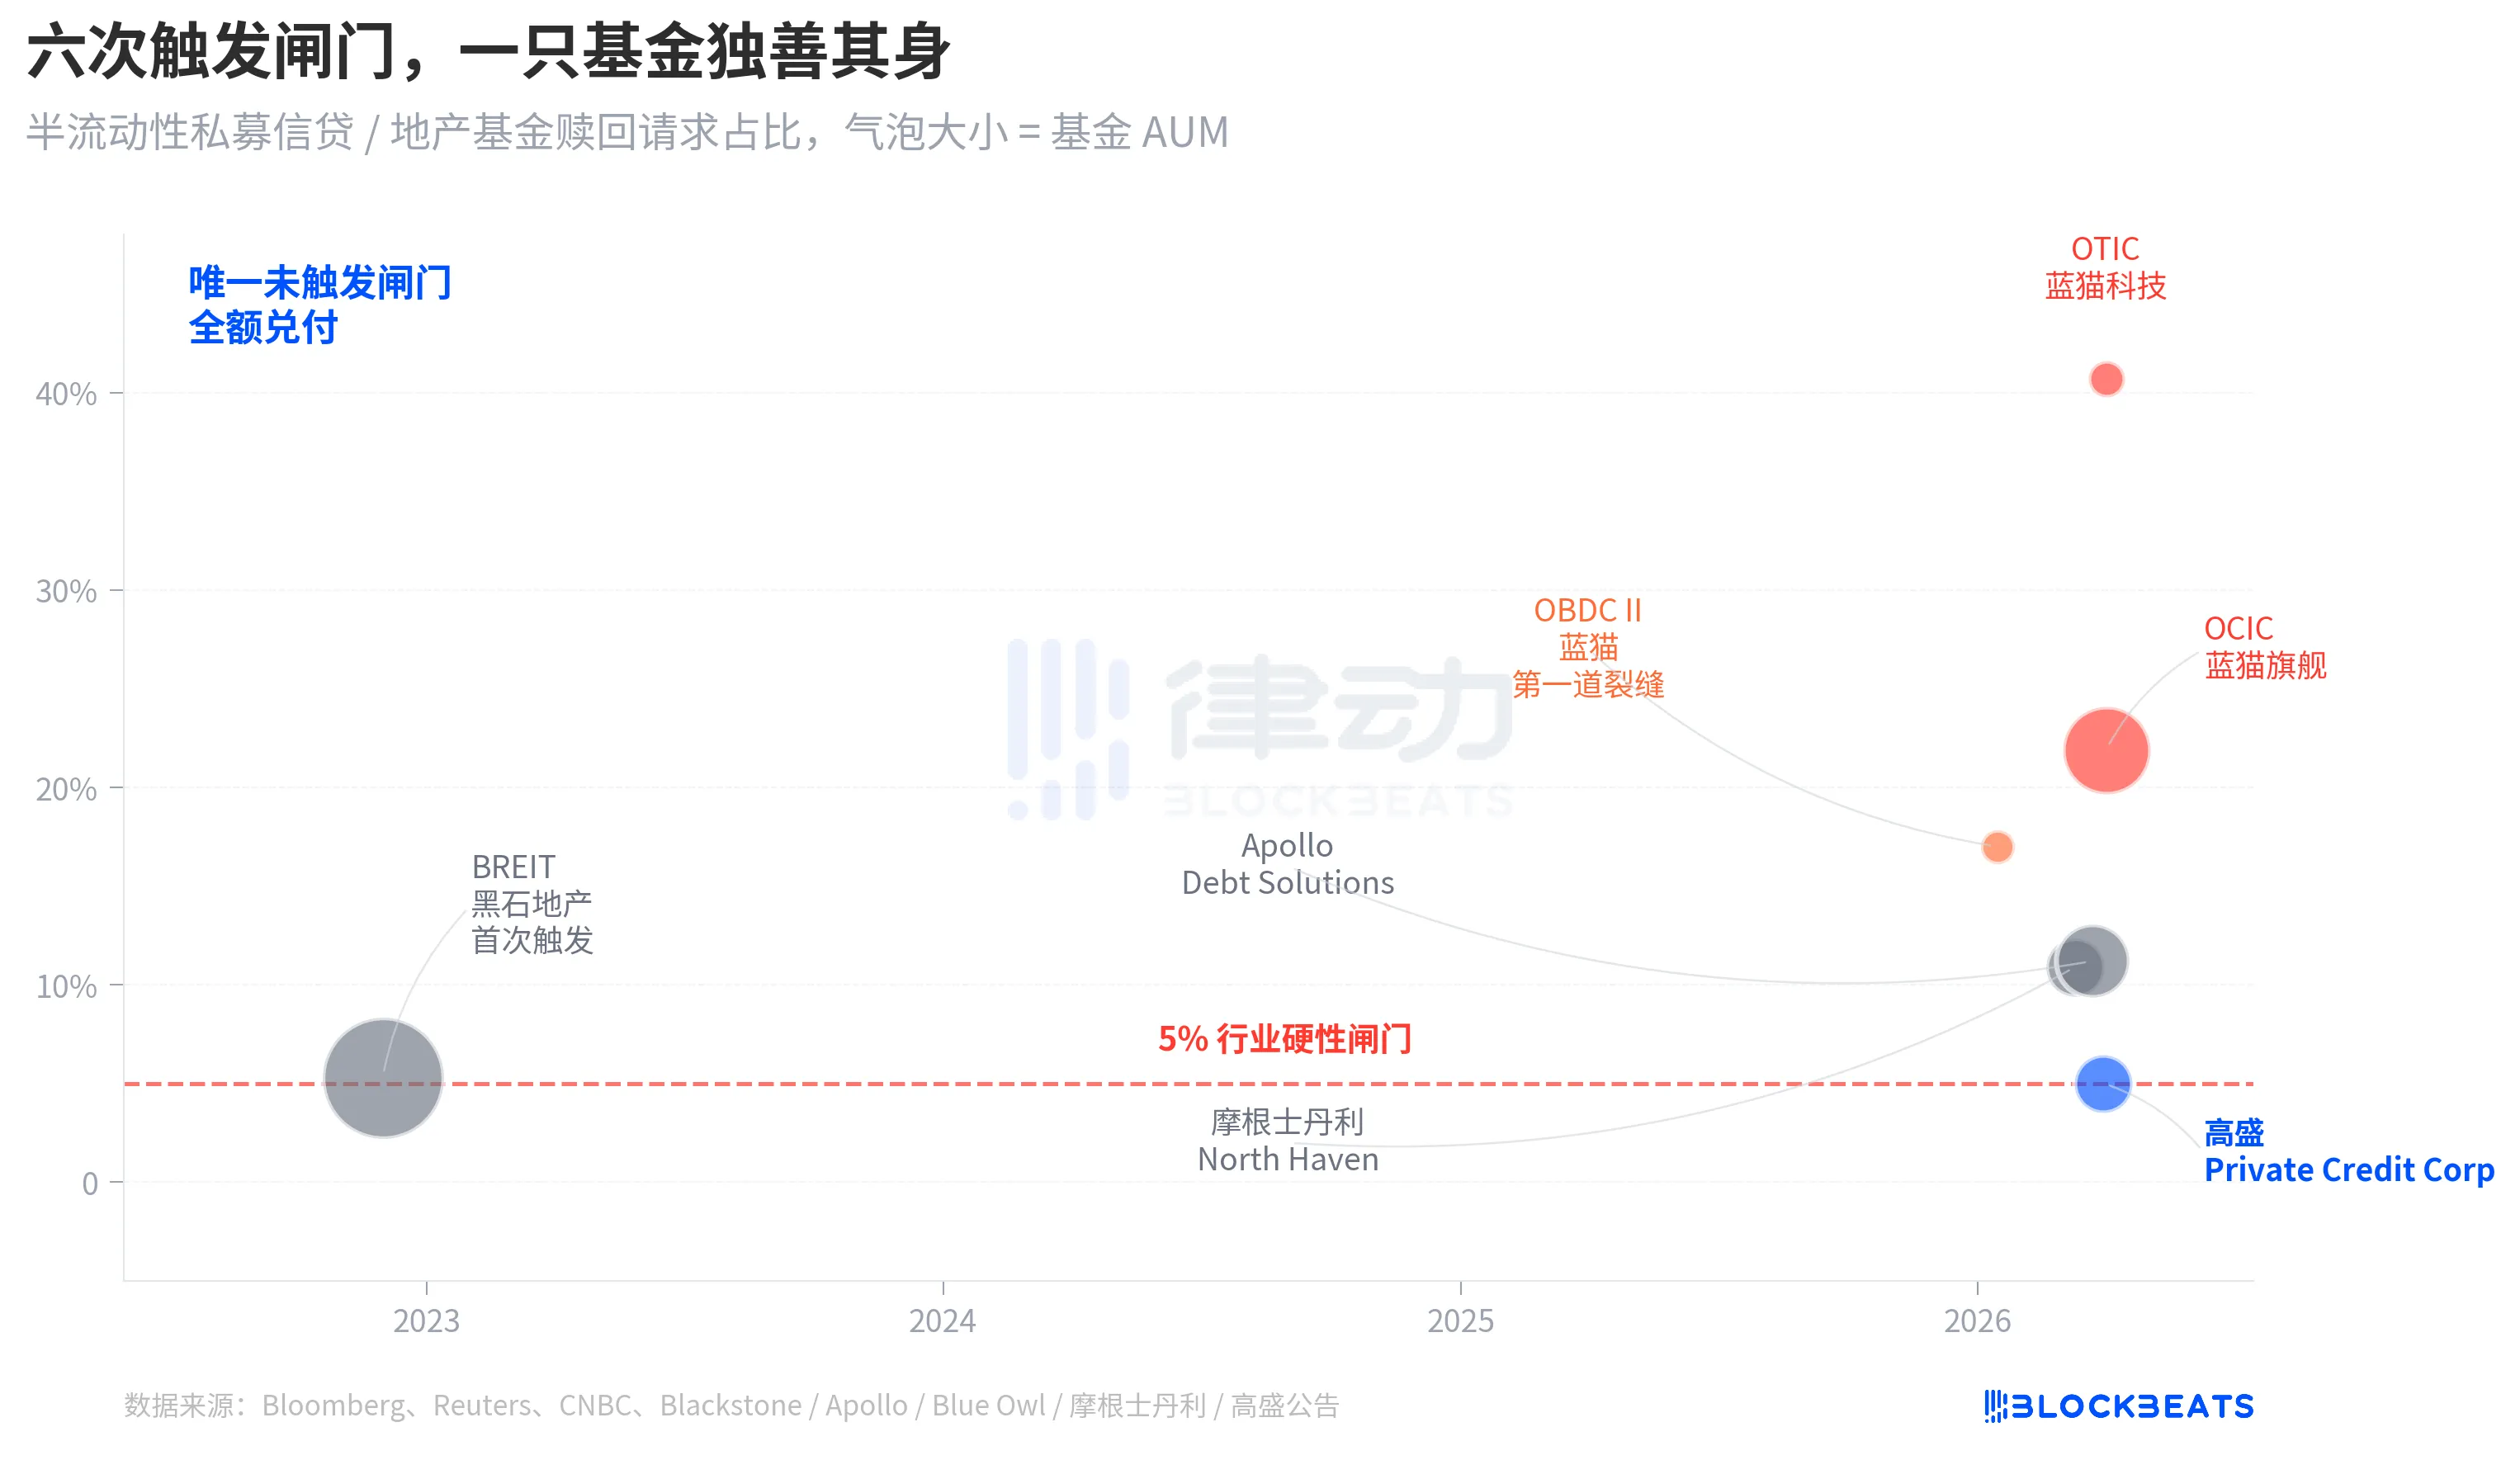
In November 2022, Blackstone’s non-traded real estate trust BREIT became the first to trigger this gate, marking the first systemic liquidity event under the perpetual semi-liquid structure. According to Caproasia data, BREIT released only 25% of total redemption requests in January 2023. By November 2023, cumulative redemptions totaled $14.3 billion. That event was interpreted as an isolated incident in the real estate sector, with no spillover into private credit markets.
Four years later, the same crack spread from real estate to credit. In January 2026, Blue Owl’s OBDC II reported 17% redemption requests—first warning signal. On March 11, Morgan Stanley North Haven triggered the gate. On March 23, Apollo Debt Solutions did the same. On April 2, Blue Owl’s OCIC and OTIC simultaneously breached the gate. Within seven days, four top-tier asset managers’ flagship BDCs were forced through the same threshold, while Goldman Sachs narrowly avoided it by just 0.001% in the same quarter.
The structural fragility of semi-liquid perpetual BDCs was not exposed only by Blue Owl’s recent redemption wave. It had been evident since BREIT’s 2022 event—but for four years, no one truly took it seriously.
Root Cause: 80% of OTIC Exposed to Tech & Healthcare
Returning to the central question: Why, despite identical structures and timing, did Goldman and Blue Owl face outcomes 8x apart? The answer lies in dissecting OTIC’s portfolio.
According to KBRA ratings reports and Blue Owl OTIC’s Q4 2024 financial disclosures, as of year-end 2025, OTIC’s portfolio stood at $6.2 billion, comprising 190 companies across 39 end markets. Of these, 92% were backed by private equity, and 93% held first-lien senior secured loans. On paper, it was a solid fund. But its sector concentration was highly unusual: system software accounted for 16.1%, healthcare tech for 13.0%, and application software for 12.4%—three segments together representing 41.5% of the portfolio.
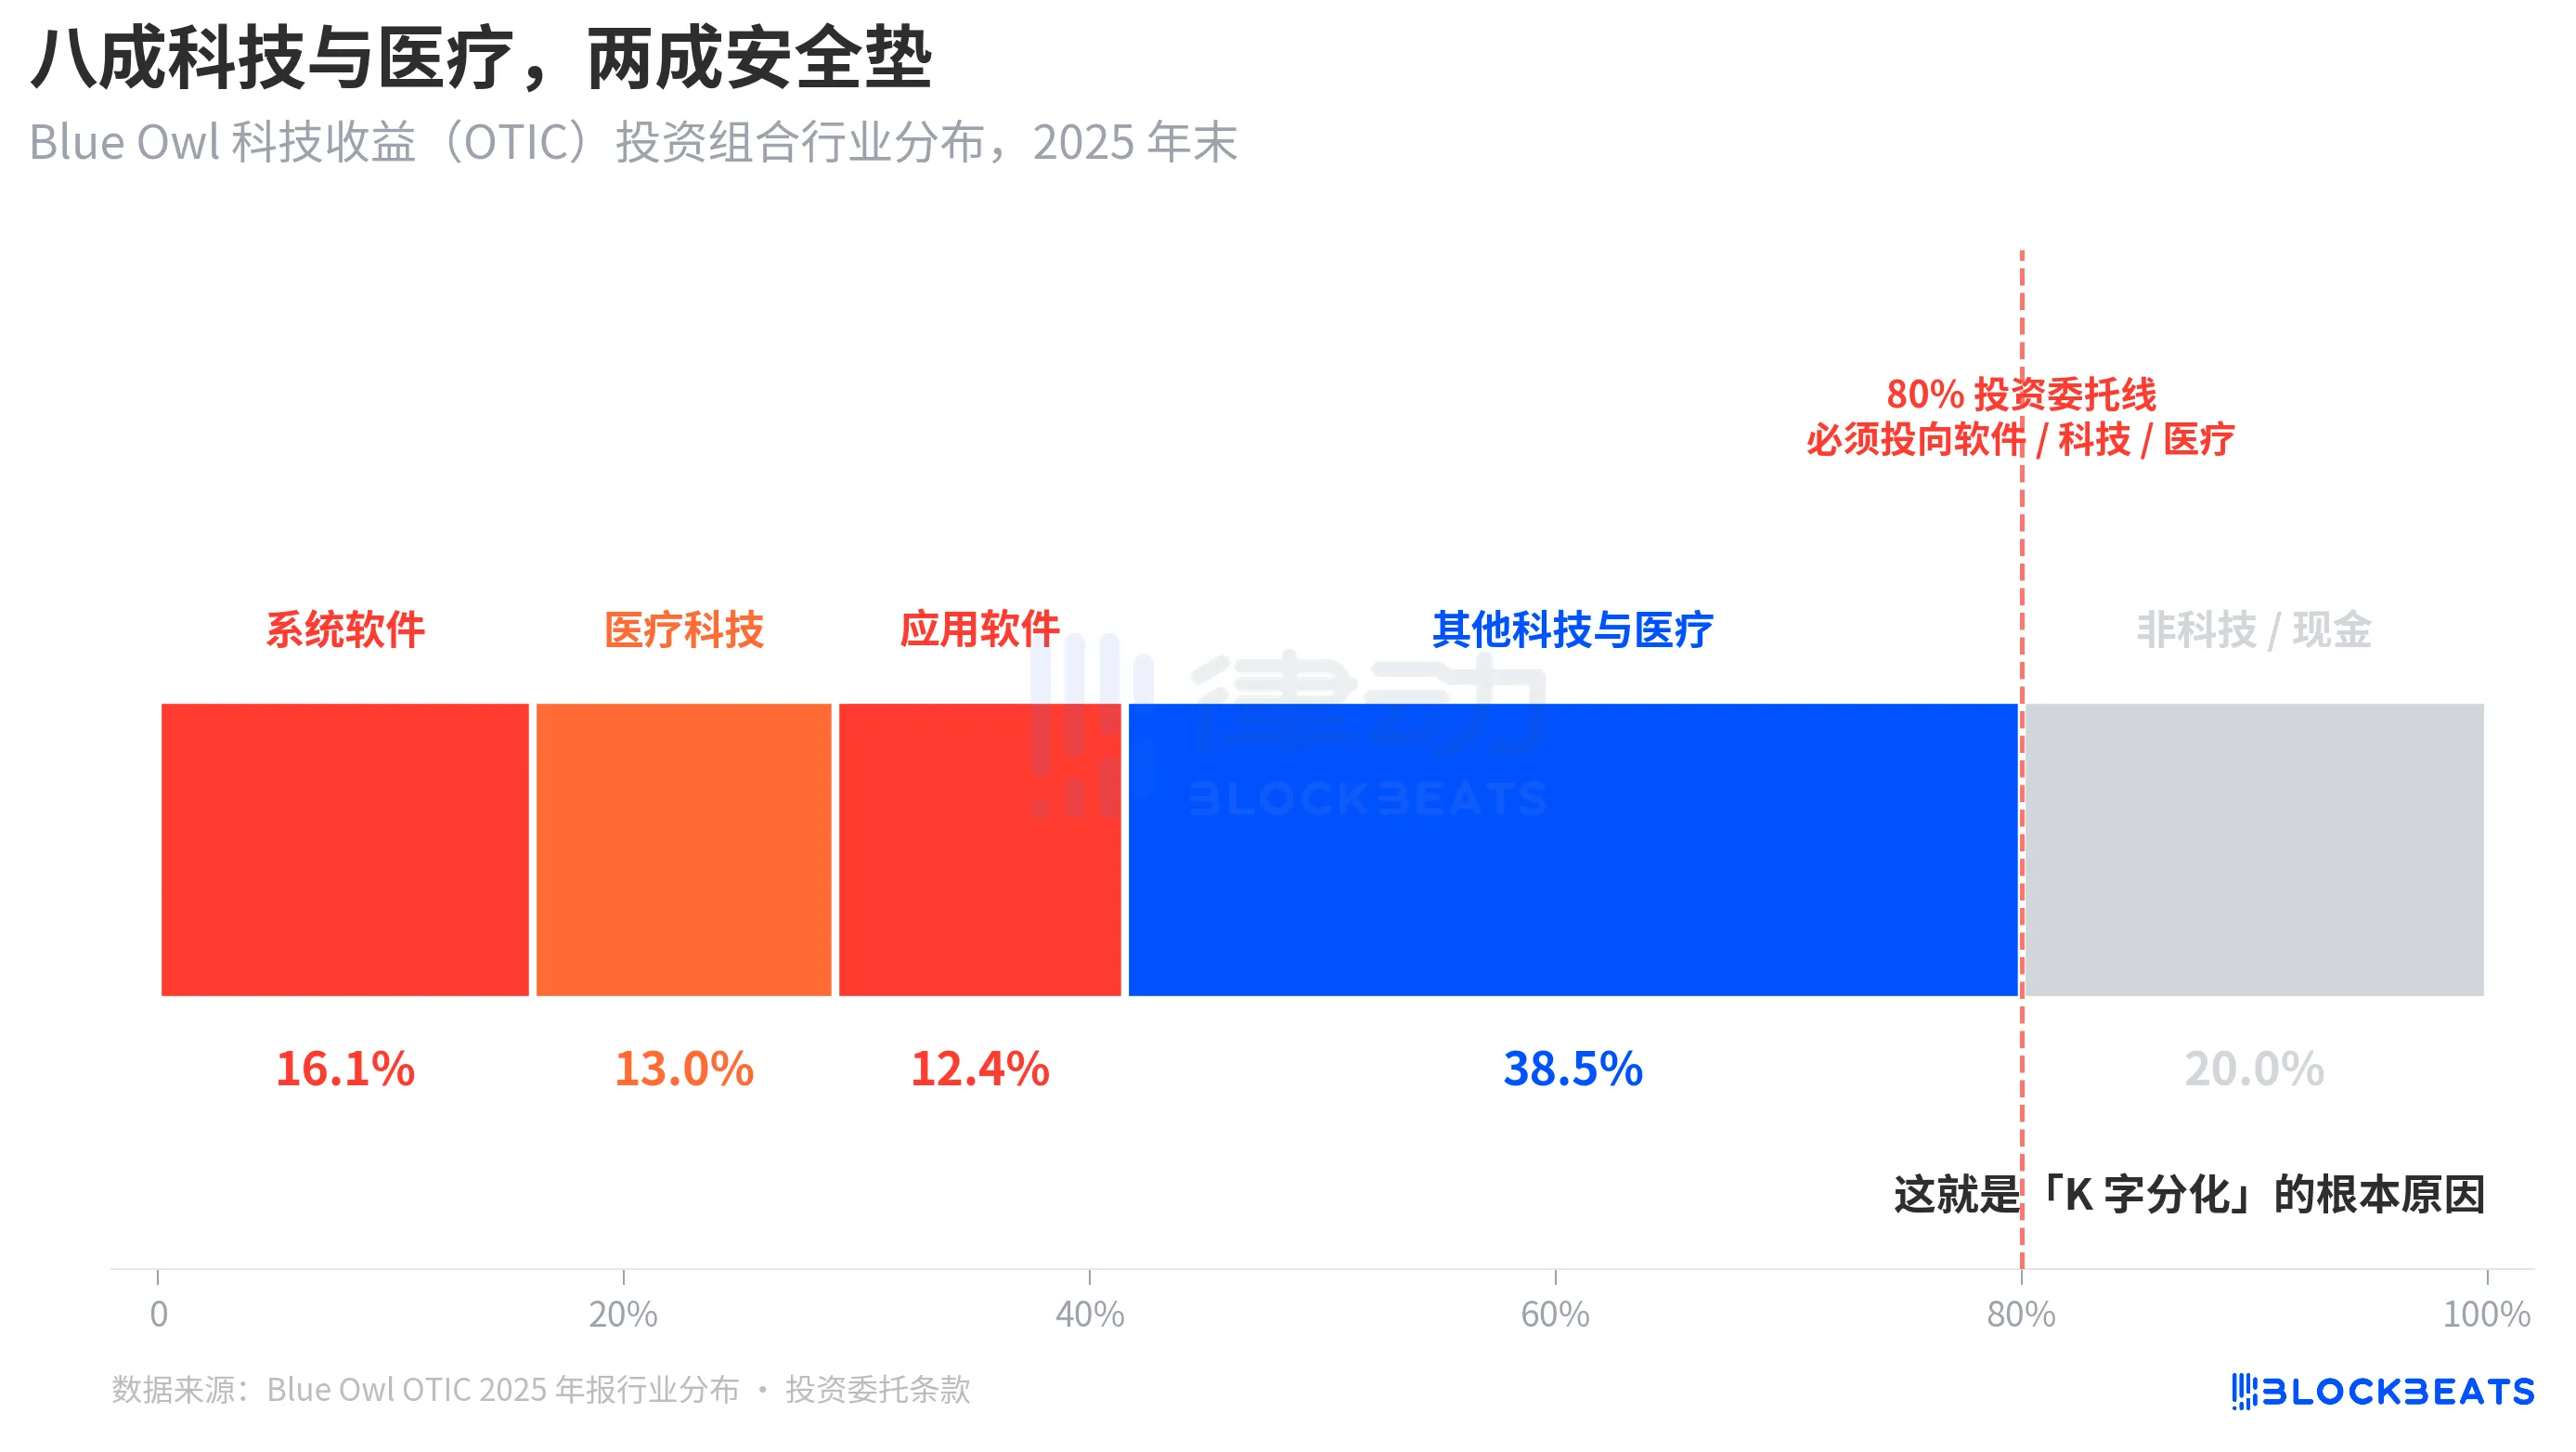
Critically, this wasn’t a temporary management preference—it was enshrined in OTIC’s investment charter: at least 80% of total assets must be allocated to “software and technology-related” companies. Blue Owl explicitly described OTIC in public materials as “focused primarily on large, market-leading software enterprises providing mission-critical, recurring revenue solutions.” From inception, OTIC was designed as a SaaS-focused private credit fund.
Meanwhile, over the past six months, SaaS has been one of the most heavily re-rated asset classes due to AI narratives. As investors began worrying about “AI-driven disruption to long-term software subscription revenues,” a private credit fund with 80% exposure to software and tech was inevitably hit first. According to Bloomberg and Reuters reporting, Blue Owl’s management admitted in investor communications that part of the Q1 redemption pressure stemmed from “concerns about AI disrupting software firms’ business models.”
In contrast, Goldman Sachs Private Credit Corp’s portfolio (~$15.7 billion AUM) was described by Bloomberg as “significantly more diversified than peers,” with no single sector approaching OTIC’s tech concentration. Same private credit, same semi-liquid structure, same 5% gate—yet exposure to current market themes differed dramatically: 80% vs. less than 15%. One fund saw redemption rates of 40.7%; the other, 4.999%.
This is the fundamental driver of K-shaped divergence. It wasn’t the entire private credit asset class collapsing—it was funds concentrated on a single market theme experiencing distress, while diversified funds remained largely unaffected. The split occurred at the risk exposure layer, not the structural layer.
Closing Remarks
On April 6, 2026, JPMorgan CEO Jamie Dimon published his 2026 shareholder letter—coinciding with Blue Owl hitting its all-time low. He wrote: “Private credit, in general, lacks transparency and strict loan valuation marking. This makes investors more likely to sell if they perceive worsening conditions—even if actual losses are negligible.”
Dimon’s statement points to a structural flaw: private credit cannot be marked-to-market easily, so investor perception of risk often outweighs actual loss. Read in context on April 7, 2026, this carries two meanings: first, Goldman Sachs’ 0.001% margin was due to diversification, not luck. Second, the entire $1.8 trillion private credit market has yet to resolve the core tension between liquidity and opacity.
A 5% gate failed to distinguish between “good funds” and “bad funds.” Instead, it merely aggregated two fundamentally different investment decisions—“concentrated bets on current themes” versus “diversified portfolios”—onto the same K-line chart and settled them in one fell swoop.
Disclaimer: Contains third-party opinions, does not constitute financial advice
Musk's fortune may surpass Bitcoin's market cap, with the gap narrowing to just $80 billion during Friday's trading session
2 hours ago
Aerodrome is set to launch its Predictive Allocation mechanism in July, introducing the concept of prediction markets to optimize liquidity incentives.
2 hours agoThe White-Haired Stock Guru Critiques Technical Analysis: Astrology for Traders, Yet Stock Price Appreciation Is Primarily Driven by Fundamental Factors
3 hours agoBitcoin breaks below $64,000, with a 24-hour decline of 0.3%
4 hours agoDump 360 Million Tokens in One and a Half Days, Still Hold 44% of Total Supply
4 hours agoAztec Router contract on Ethereum suspected of being attacked, with $2.19 million in assets anomalously drained
4 hours agoAnalysis: Long-term BTC holders still have the capacity to generate short-term sudden sell pressure, but their long-term influence has diminished compared to previous cycles.
4 hours ago

