ChainThink
Stay ahead, master crypto insights
Week 16 On-Chain Data: Structural Supply-Demand Imbalance Intensifies, Data Reveals a Solid Blueprint for the Next Uptrend?
Week 16 On-Chain Data: Structural Supply-Demand Imbalance Intensifies, Data Reveals a Solid Blueprint for the Next Uptrend?
2025-04-30 18:38
Original Title: "The On-Chain 'Fusion' of Crypto: Structural Supply-Demand Imbalance Intensifies, Data Reveals the Solid Blueprint for the Next Uptrend? | WTR 4.28"
Original Source: WTR Research Institute
This Week Recap
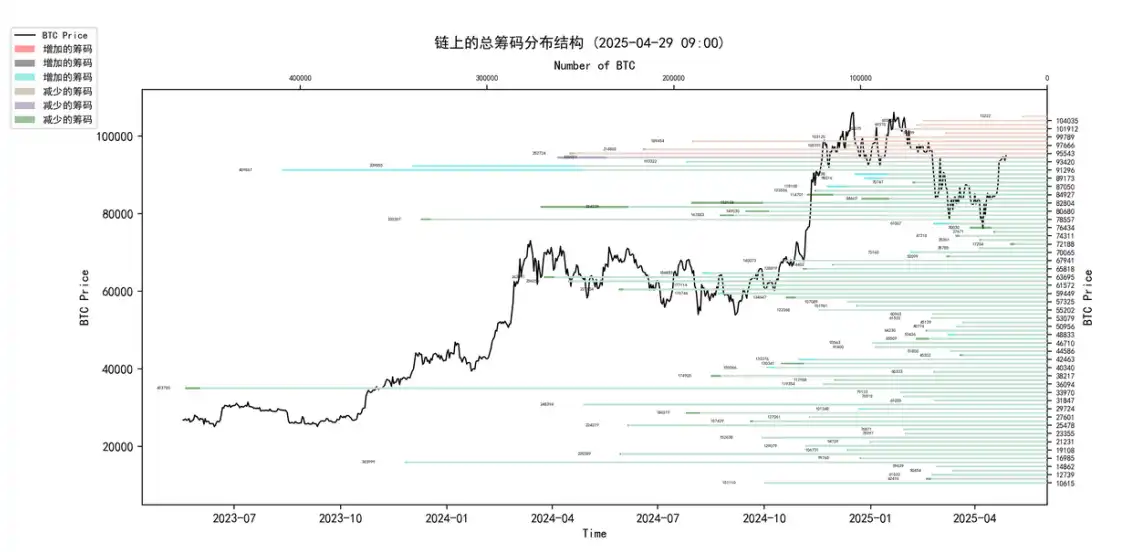
From April 21 to April 28, Ice Orange reached a peak near $95,758 and dipped close to $85,144, with an oscillation range of approximately 12.46%. Observing the chip distribution chart, a significant concentration of trading volume exists around $92,000, indicating potential support or resistance.
• Analysis:
1. 60,000–68,000: ~1.53 million units;
2. 76,000–89,000: ~1.72 million units;
3. 90,000–100,000: ~2.19 million units;
• Short-term downside break below 75,000–80,000 has an 80% probability of being avoided;
• Short-term upside break above 95,000–100,000 has a 50% probability of being avoided.
Key Developments
Economic News
• Key Data Releases This Week:
◦ Wednesday: Q1 GDP (previous: 2.4%, expected drop to 0.4%);
◦ Friday: Non-Farm Payrolls (previous: 228K, expected drop to 135K) and Unemployment Rate (previous: 4.2%, expected: 4.2%);
◦ Wednesday also features Core PCE (previous: 2.6%, expected: 3.2%), and Tuesday includes JOLTs Job Openings.
• Overall bearish outlook: Expectations for U.S. economic and employment data this week are broadly weak, with sharp declines anticipated in both GDP and non-farm payrolls.
• Recession concerns: Barclays questions whether the U.S. can avoid a recession this year, arguing that this strengthens the case for Fed rate cuts.
• Federal Reserve & Monetary Policy:
◦ Policy criticism: Fed policymaker and prominent candidate Kevin Warsh harshly criticized the current Fed predicament as "self-inflicted," urging rigorous scrutiny and oversight, along with strategic reset to restore credibility.
◦ Quiet period: The Fed has entered its pre-meeting quiet period ahead of the May 7 policy meeting; market consensus expects a third consecutive hold on interest rates.
◦ Rate cut expectations: Strong demand for rate cuts exists, though timing remains divided.
▪ LSEG data shows July rate cut expectations are fully priced in, while June still retains some possibility.
▪ CME data indicates less than 10% probability of a June cut, with June probabilities ranging between 60–70%, and July fully priced in (fully priced).
◦ Market rationale for rate cuts: Beyond recession fears, U.S. banks warn that the dollar is on a long-term depreciation trajectory, with capital expected to continue flowing out until the Fed cuts rates.
▪ Economist Javier Bianchi argues that tariffs represent a negative demand shock (i.e., deflationary pressure), compelling the Fed to cut rates to prevent worse economic outcomes.
• Tariff Impact:
◦ Barclays notes that Trump’s relatively moderate tariff rhetoric has temporarily calmed markets, but outcomes remain highly uncertain.
◦ Economists view tariffs as a negative demand shock with deflationary effects—another key reason the Fed may need to cut rates.
• Dollar Outlook:
◦ U.S. banks warn the dollar is on a long-term downtrend.
Crypto Ecosystem Developments
1. Market Sentiment & Capital Flows:
◦ Market sentiment rebound: The Crypto Fear & Greed Index rose to 54 (neutral). CryptoQuant Bull Index hit 60, signaling renewed optimism.
◦ Capital inflow into crypto: Analyst ali_charts reports nearly $9 billion flowed into the crypto market over the past week, reflecting renewed interest. Matrixport observes early signs of recovery in dollar-to-crypto conversion, improving liquidity.
◦ Stablecoin growth: Tether issued an additional $1 billion in USDT on April 28. Total stablecoin market cap increased by 1.61% over the past seven days to $238.101 billion.
◦ Rising demand: Analysts note growing demand for BTC and stablecoin liquidity.
2. Crypto Market (BTC):
◦ Price performance: BTC price rebounded to the $93,000–$95,000 range.
◦ Active short-term traders: IntoTheBlock data shows a significant increase in BTC holdings among short-term traders last week, indicating resurgent speculative demand—a potential precursor to broader upside.
◦ Market expectations: Bitfinex analysts note increasing market anticipation for BTC to reach higher levels in Q2 2025.
3. Crypto ETFs:
◦ BTC Spot ETFs: Net inflows totaled $3.0629 billion last week. BlackRock’s IBIT recorded nine consecutive days of net inflows, accumulating $1.6 billion in BTC during that period. Continued ETF inflows reflect mild market optimism.
◦ ETH Spot ETFs: Net inflows amounted to $157.1 million last week. Grayscale and SEC discussed ETH ETP staking regulations, proposing amendments to allow staking.
◦ XRP Futures ETFs: SEC approved three XRP futures ETFs, scheduled for listing on April 30, 2025.
4. Regulation & Policy:
◦ Federal Level (SEC):
▪ SEC Commissioner Hester Peirce criticized the current U.S. crypto regulatory environment as chaotic ("playing lava floor blindfolded"), calling for swift establishment of clear compliance channels and guidance.
▪ SEC approved XRP futures ETFs.
▪ SEC held discussions with Grayscale on ETH ETF staking issues.
◦ State Level: Arizona’s two BTC reserve bills advanced to third reading; if passed, Arizona would become the first U.S. state to establish a BTC reserve.
5. Other:
◦ Hong Kong investment fraud alert: HK police warned against crypto-related investment scams on social platforms.
◦ Market outlook: Markets anticipate a gradual warming of crypto assets this summer following a potential pause in rate cuts.
Long-Term Insight: Used to assess our long-term condition—bullish/bearish/structural shift/neutral state
Mid-Term Exploration: Used to analyze our current phase, duration, and challenges ahead
Short-Term Observation: Used to assess short-term market conditions, directional trends, and event probabilities under specific premises
Long-Term Insight
• Short-Term Holder Realized Price
• Buy/Sell On-Chain Depth Chart
• Illiquid Long-Term Whales
• U.S. Spot ETF Flow
• Large Net Transfers on Exchanges
(Below: Short-Term Holder Realized Price)
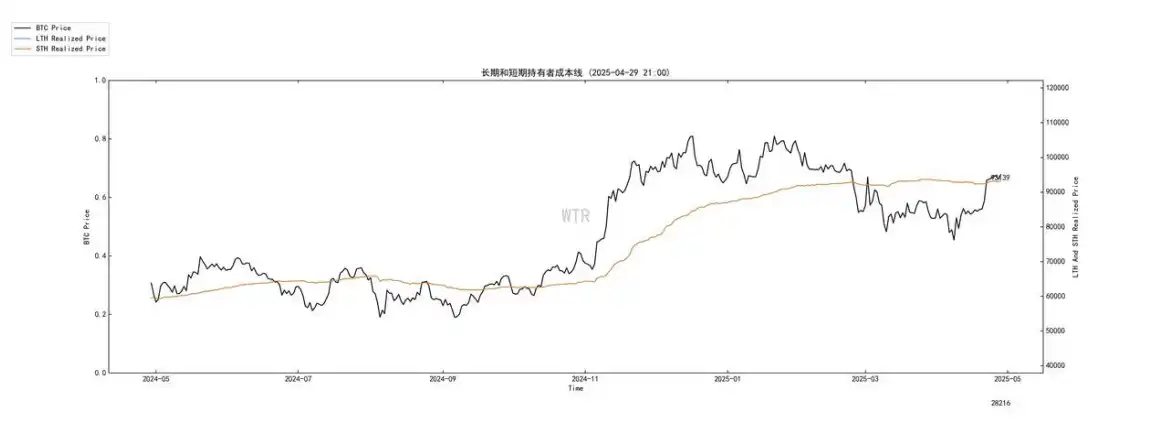
On average, recent entrants are currently in profit. This significantly reduces potential selling pressure, as short-term speculators (at $93,600) lack urgent need to recover costs or trigger stop-losses. Instead, profitability may strengthen holding confidence or encourage further entry—indicating positive market sentiment and a healthy short-term holder status.
(Below: Buy/Sell On-Chain Depth Chart)
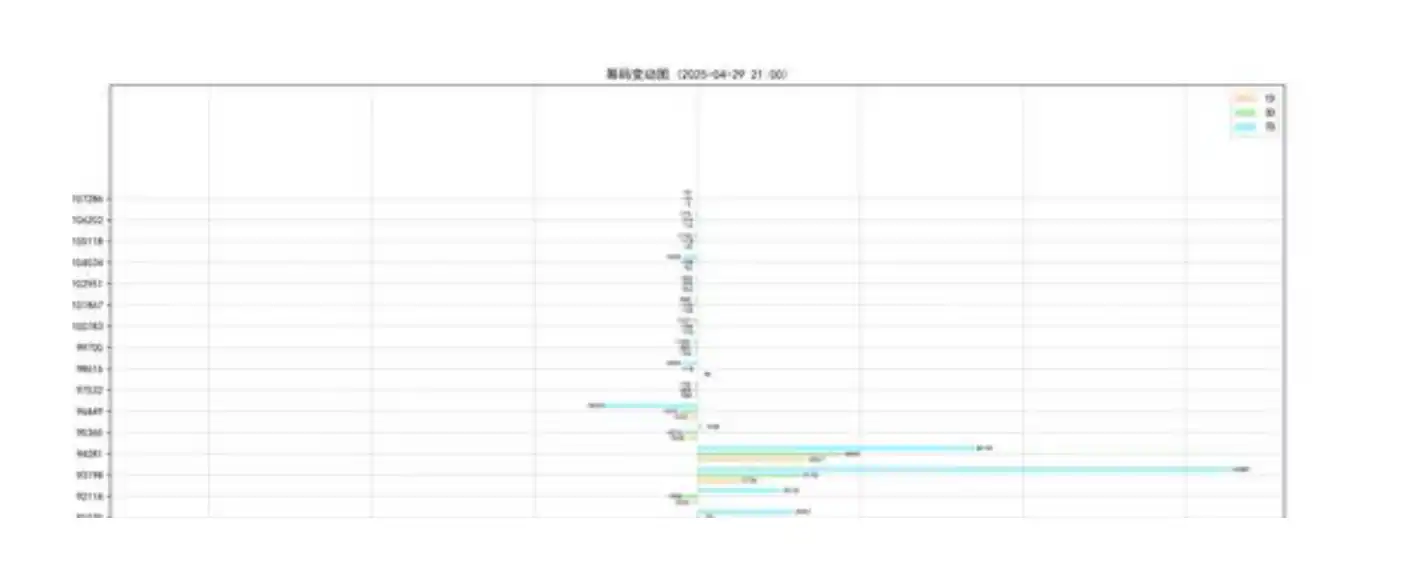
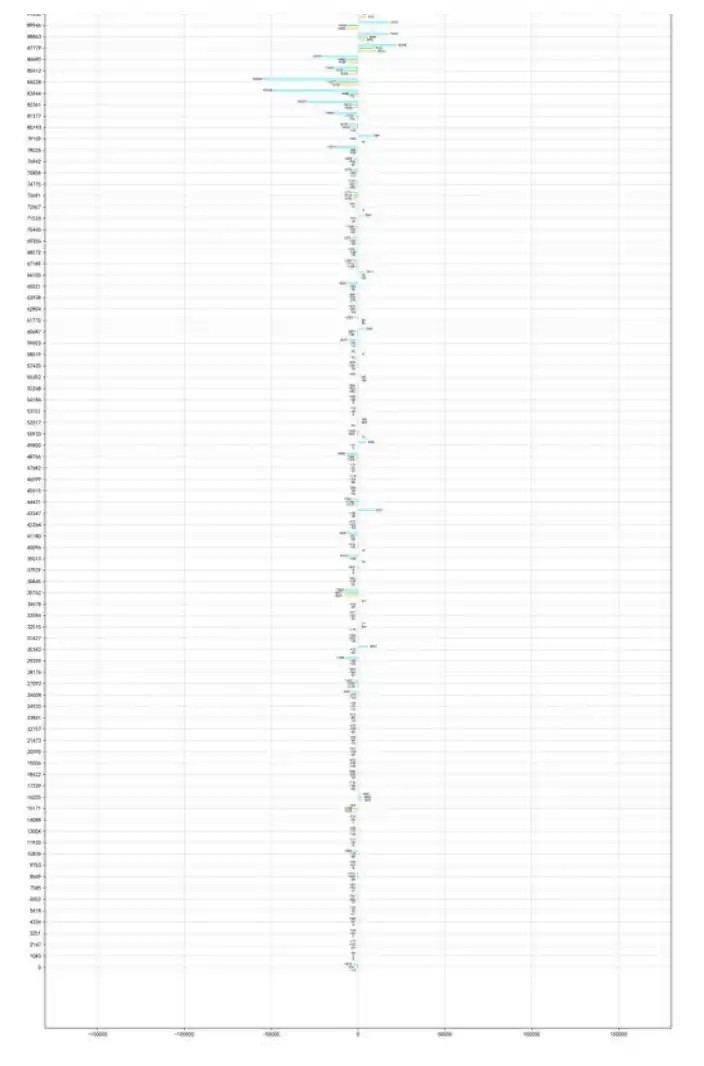
Directly reflects the current on-chain supply-demand structure. A large volume of on-chain buy orders indicates strong market absorption and depth, meaning robust buying interest during pullbacks.
(Below: Illiquid Long-Term Whales)
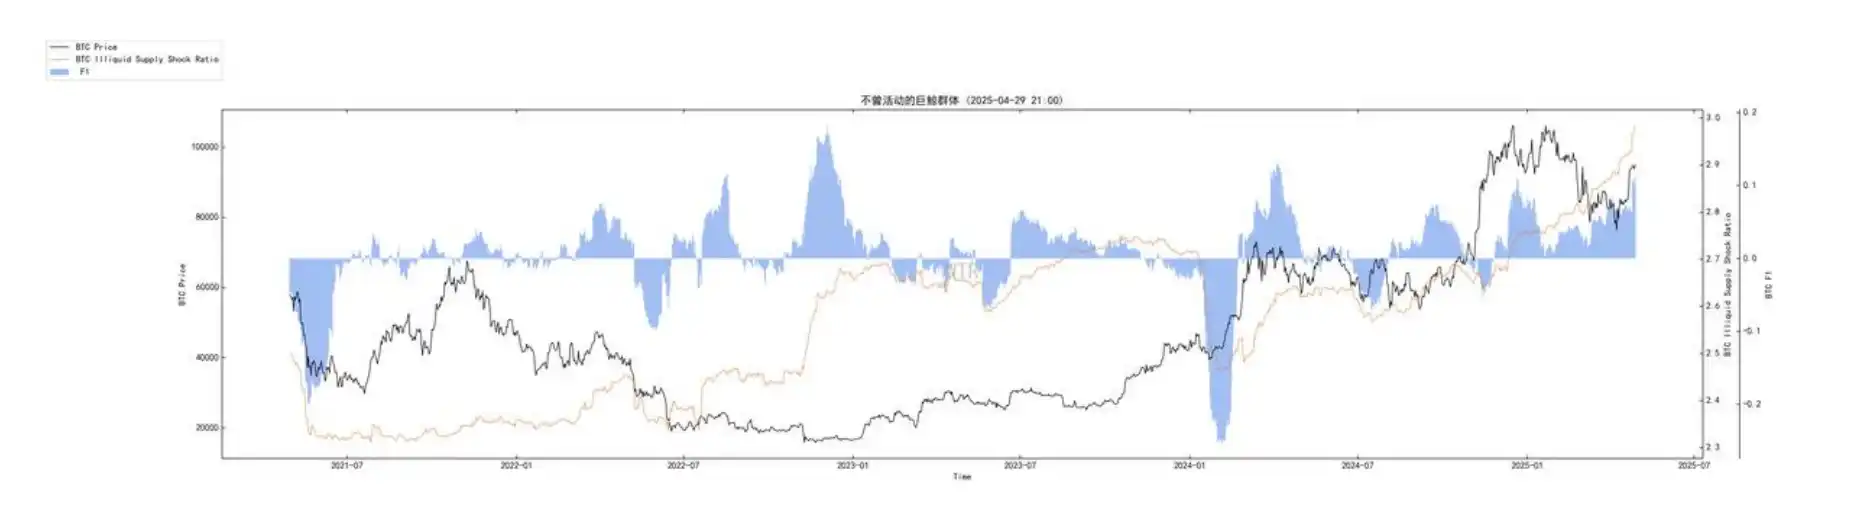
This again confirms that the speed at which crypto assets transition from tradable to locked positions is rapid and shows no sign of slowing. Reflects deep, sustained, and intense accumulation behavior—the "active supply" is rapidly being withdrawn from circulation. The supply-side contraction effect is intensifying, representing a critical long-term bullish fundamental.
(Below: U.S. Spot ETF Flow)
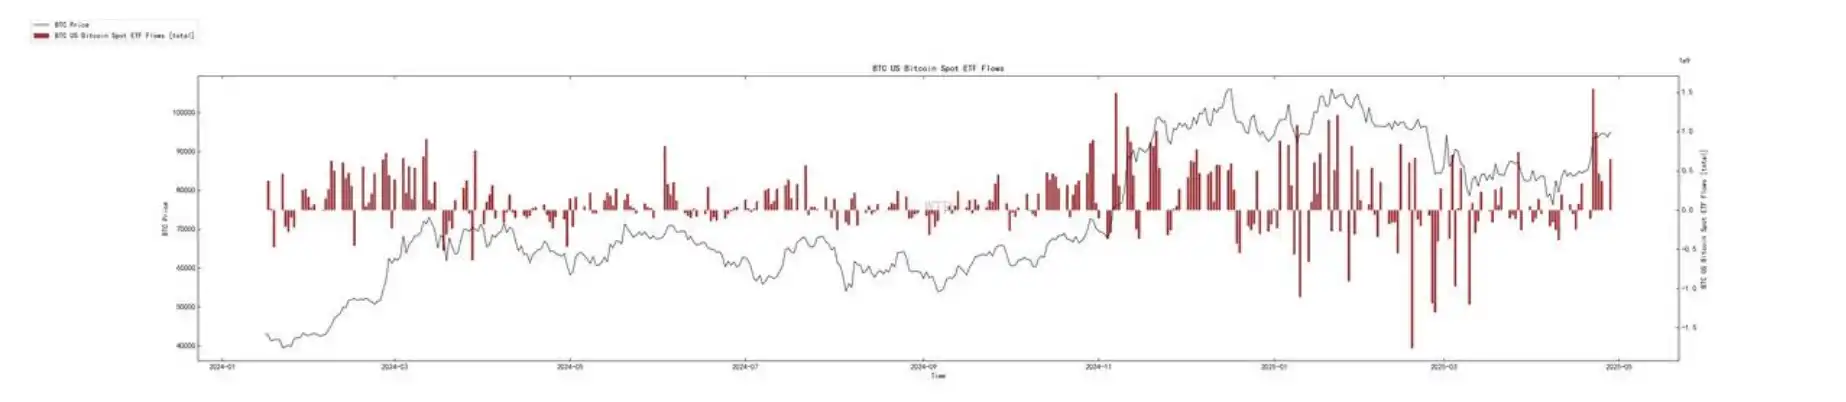
New purchasing demand from the key compliant channel—U.S. spot ETFs—has not only returned but is maintaining considerable strength and continuity. This force directly and persistently absorbs BTC supply from the market, serving as a crucial new buyer source supporting current prices.
(Below: Large Net Transfers on Exchanges)
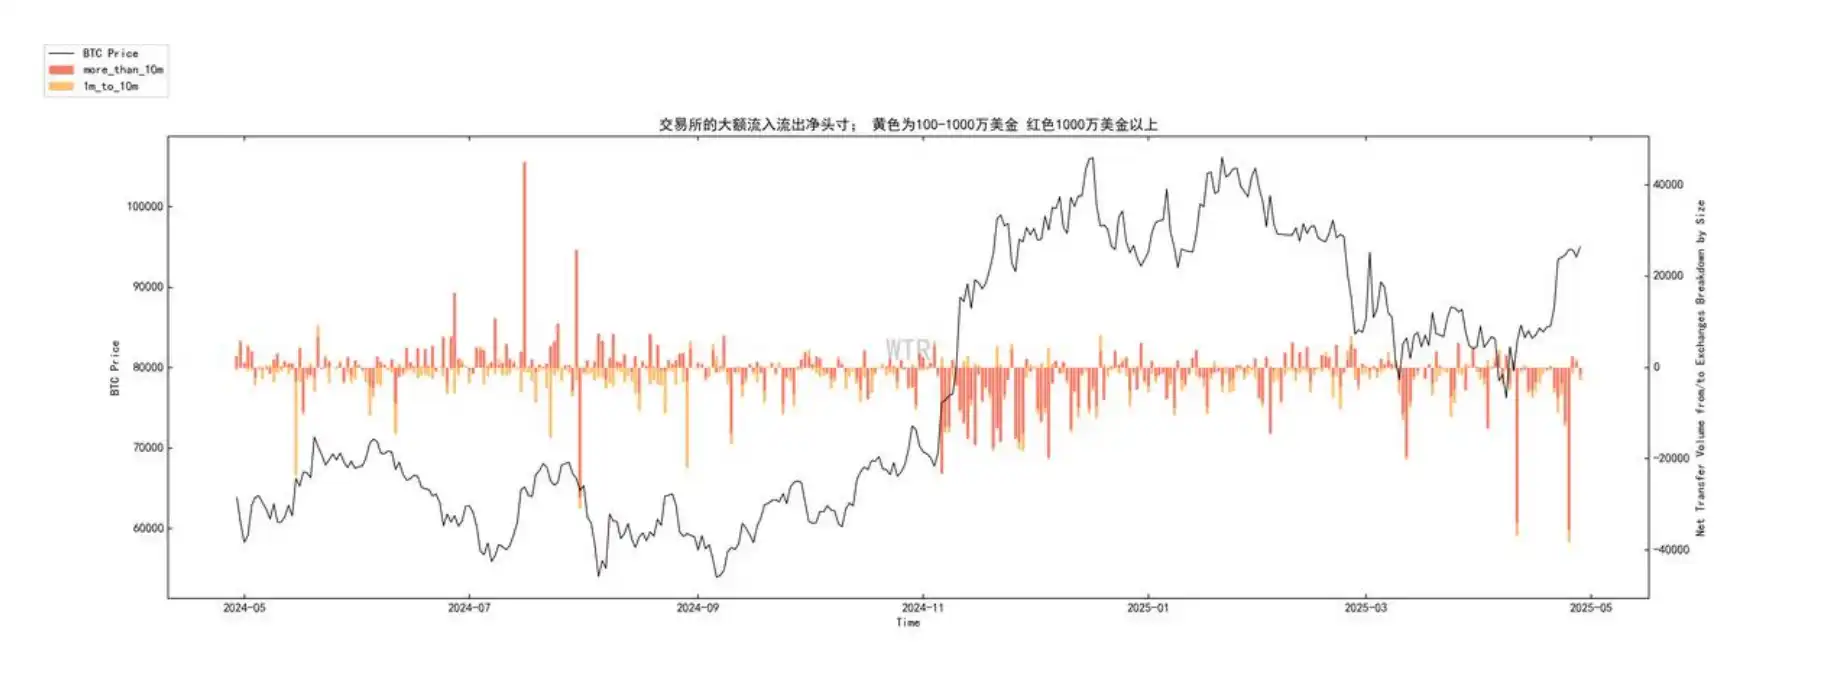
Confirms that major entities (whales) continue to withdraw Bitcoin from exchanges in large volumes. Their strategic accumulation is ongoing, further reducing immediate sell pressure on centralized exchanges and reinforcing long-term bullish sentiment.
Comprehensive Analysis & Logical Reasoning Chain:
1. Starting Point – Macro Context & Market Sentiment: Macroeconomic outlook remains cautious (data miss expectations), yet markets have strongly priced in future rate cuts. Crypto sentiment has significantly improved, with accelerating capital inflows (macro/news-driven).
2. Validation – Demand Confirmation: On-chain data strongly validates and reinforces the recovery of capital inflows and demand; continued strong net inflows into ETFs (Chart 4), active short-term traders already in profit (Chart 1), and rising demand for BTC and stablecoins (news-driven).
3. Validation – Core Player Behavior: On-chain data shows core players are extremely bullish and taking action; whales continuously withdrawing large volumes from exchanges (Chart 5), and long-term holders (LTH) continue high-speed accumulation (Chart 3 – illiquid long-term whales).
4. Escalating Supply-Demand Imbalance: Demand side (ETFs, internal demand) remains strong, while supply side (whale withdrawals locking, continuous LTH accumulation) is rapidly being removed from circulation, causing a sharp decline in circulating supply. The structural supply-demand imbalance is forming and intensifying.
5. Current State: Market is in a healthy uptrend or consolidation phase awaiting breakout: Short-term holders are profitable, reducing sell pressure (Chart 1); strong buy-side support beneath (Chart 2 – on-chain order book walls); upward resistance exists (Chart 2 – cost-based sell walls), but faces powerful and persistent buyers (Chart 4 – ETFs + Chart 5 – whales + internal demand), with supply continuing to contract (Chart 3 – illiquid long-term whales).
6. Core Driver: The primary driver behind the current market is structural supply-demand imbalance—driven by new demand from ETFs, combined with whale and LTH accumulation leading to reduced supply—and strong expectations for macro liquidity improvement (rate cuts).
Future Outlook:
• Short-to-Mid Term: High probability of upward consolidation, challenging key resistance levels
◦ Strong on-chain support (Chart 2 – buy wall, Chart 5 – whale accumulation) and sustained demand injection (Chart 4 – ETF inflows) will limit downside. Profitable short-term holders (Chart 1) reduce panic-selling risk. Market is likely to continue testing higher levels, primarily facing resistance from short-term speculative sell walls at profit thresholds such as $101,000 or $116,000.
◦ Market bias leans toward upward consolidation or strong sideways consolidation at higher levels. Breaking through key resistance zones like $100k–$101k is the main near-term focus, requiring sustained ETF inflows and whale purchases to absorb upper-level sell pressure.
◦ Pullbacks are expected to encounter strong support.
• Mid-to-Long Term: Supply contraction effect drives massive upside potential
◦ As long as whale net outflows (Chart 5) and the rapid growth of illiquid long-term whales (Chart 3) persist, the supply contraction effect will become increasingly pronounced.
◦ Over time, fewer “active” Bitcoins will be available for trading. If macro rate cuts materialize as expected, improving liquidity outlook, combined with the persistent structural demand from ETFs (Chart 4), could trigger a more violent “supply squeeze” move.
◦ Outlook:
Long-term prospects are highly optimistic. Based on the exceptionally strong on-chain fundamentals (rapid supply locking + sustained demand infusion), the market is laying a solid foundation for the next significant upswing. After breaking key resistance (e.g., $100k), upside potential will expand further. Specific timing depends on macro catalysts, but the on-chain structure clearly points to a sustained upward trend.
Mid-Term Exploration
• Liquidity Supply Volume
• Net Position of Stablecoin Supply
• Whale Composite Score Model
• Multi-Level Structure Analysis
• Net Position Trend on Exchanges
(Below: Liquidity Supply Volume)
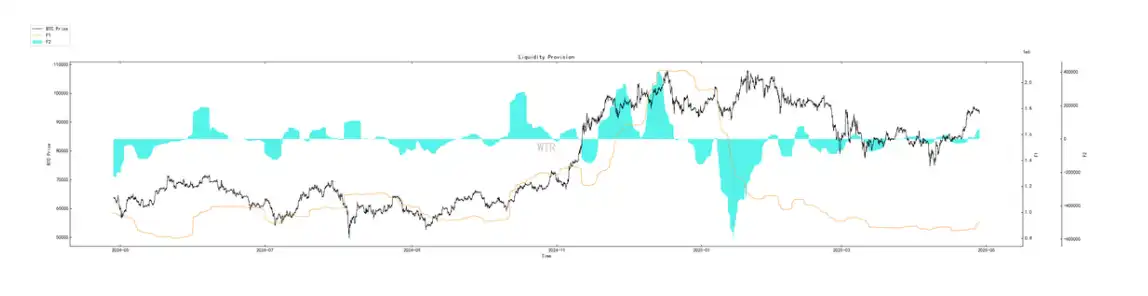
Liquidity supply volume is undergoing healthy recovery, possibly indicating the market is slowly regaining momentum.
(Below: Net Position of Stablecoin Supply)
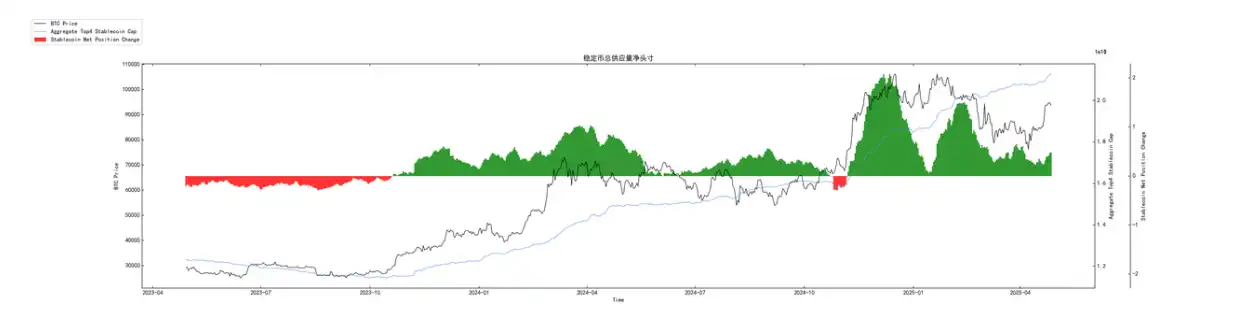
Purchasing power has recovered significantly recently, possibly indicating the market is slowly building momentum.
(Below: Whale Composite Score Model)
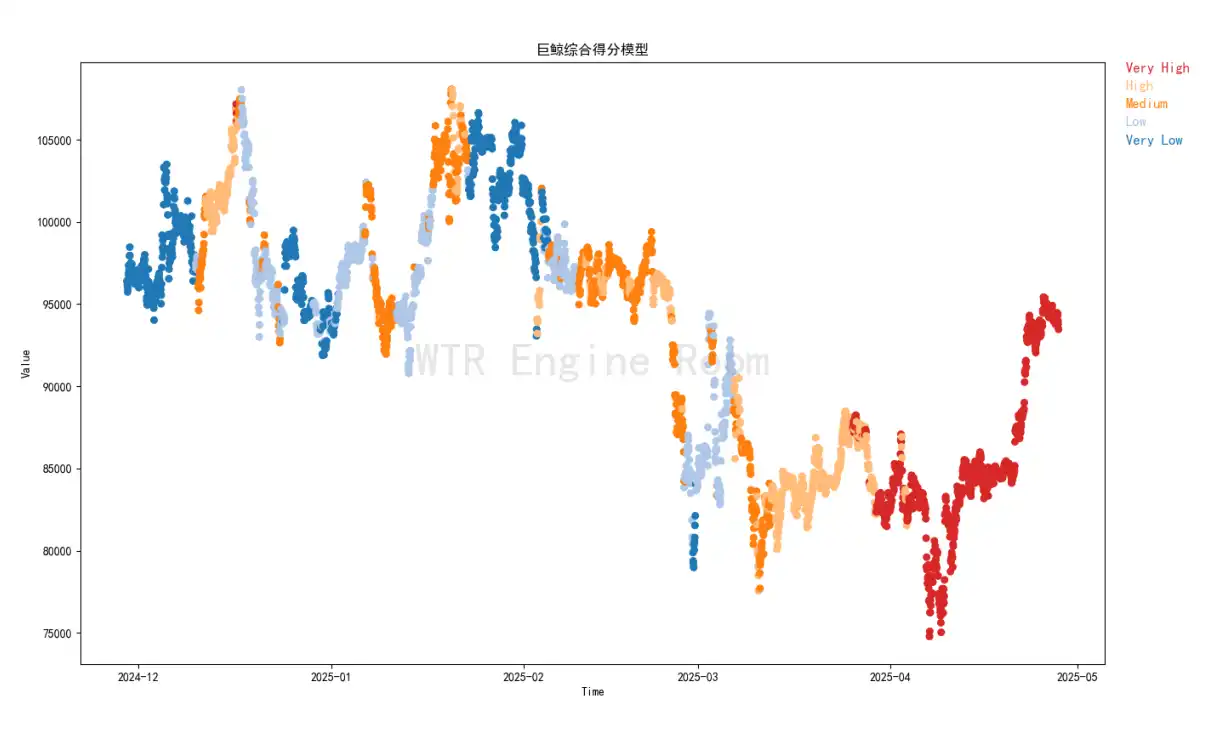
Whales still exhibit strong buying and holding intent. Throughout the recent market uptrend, whales have consistently maintained a "very high" score. The current market appears to have a solid base of large holders, which may greatly assist price stability. However, conversely, consistent whale behavior could also influence the final market outcome.
(Below: Multi-Level Structure Analysis)
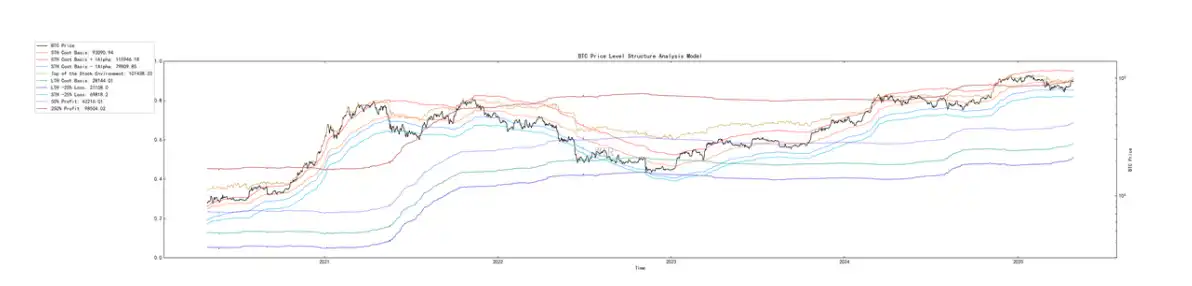
Based on current structure, the short-term cost level around $93,000 is a critical support zone. Meanwhile, as market structure evolves, the existing resistance zone is near $100,000. If purchasing power continues to grow or whale holding intent remains unchanged, there may be expectations of reaching this resistance level. However, the current market may lean toward a complex structure of adjustment and accumulation.
(Below: Net Position Trend on Exchanges)
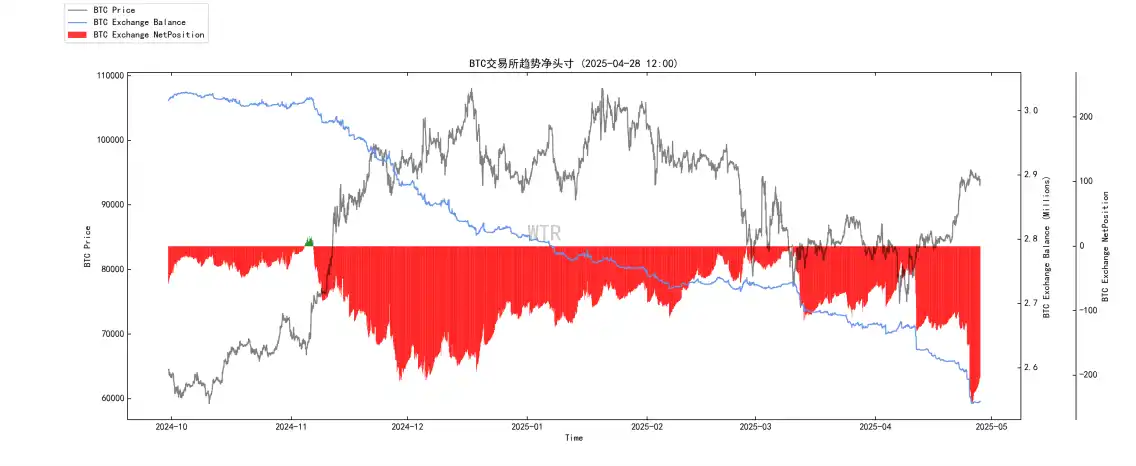
Previously, there was a significant outflow trend from exchanges, but it has now slowed. However, no structural shift indicating inflows accumulating potential sell pressure has been observed so far—suggesting the market remains within a safe adjustment boundary.
Short-Term Observation
• Derivatives Risk Coefficient
• Options Intent-to-Trade Ratio
• Derivatives Trading Volume
• Implied Volatility of Options
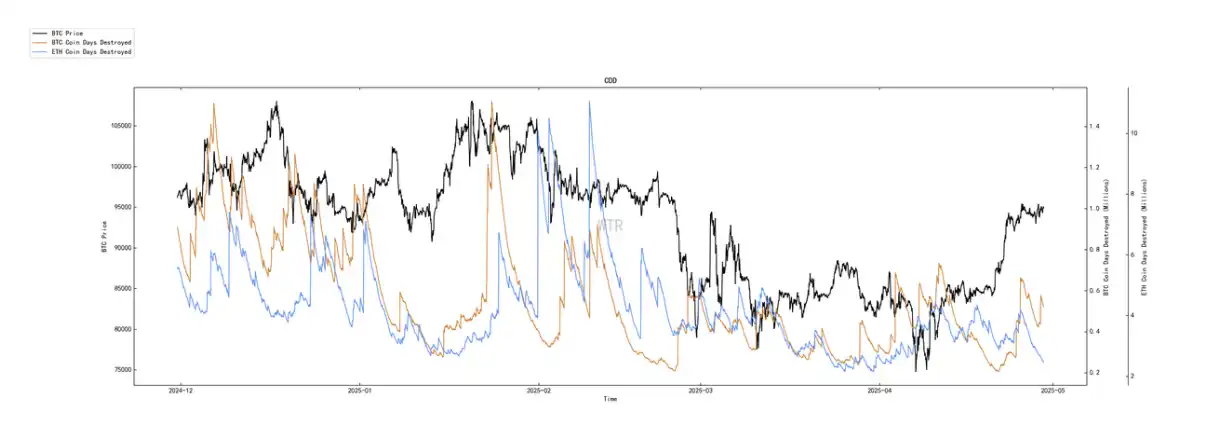
• Profit/Loss Transfer Volume
• New & Active Addresses
• Ice Orange Exchange Net Position
• Yitai Exchange Net Position
• High-Weight Sell Pressure
• Global Purchasing Power Status
• Stablecoin Exchange Net Position
• Off-Chain Exchange Data
Derivatives Rating: Risk coefficient is in red zone—derivatives risk is increasing.
(Below: Derivatives Risk Coefficient)
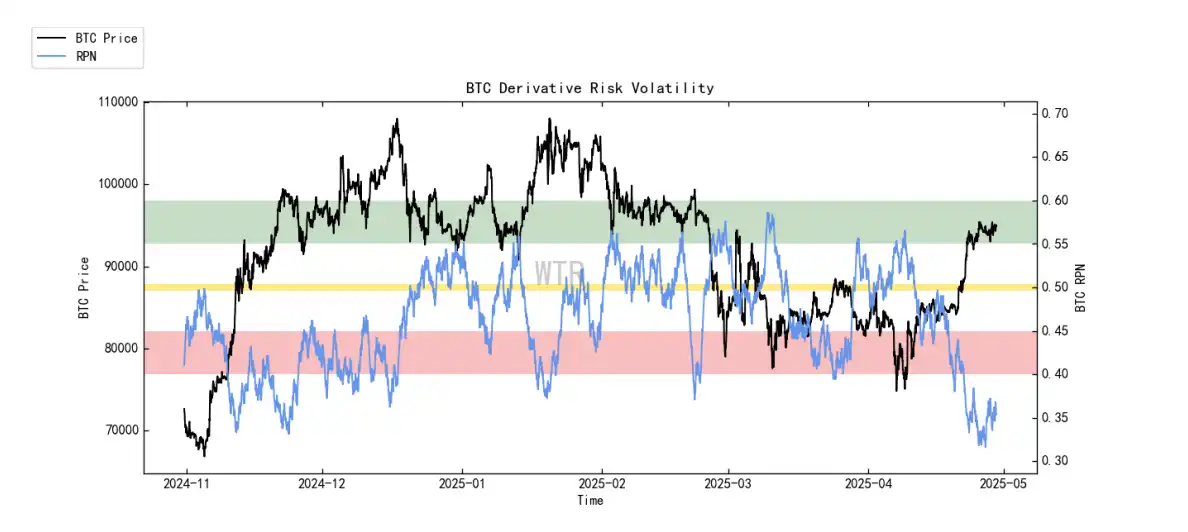
After a long-awaited squeeze, the risk coefficient remains in the red zone. Combined with current risk levels and chip accumulation patterns, the probability of another squeeze is high.
(Below: Options Intent-to-Trade Ratio)
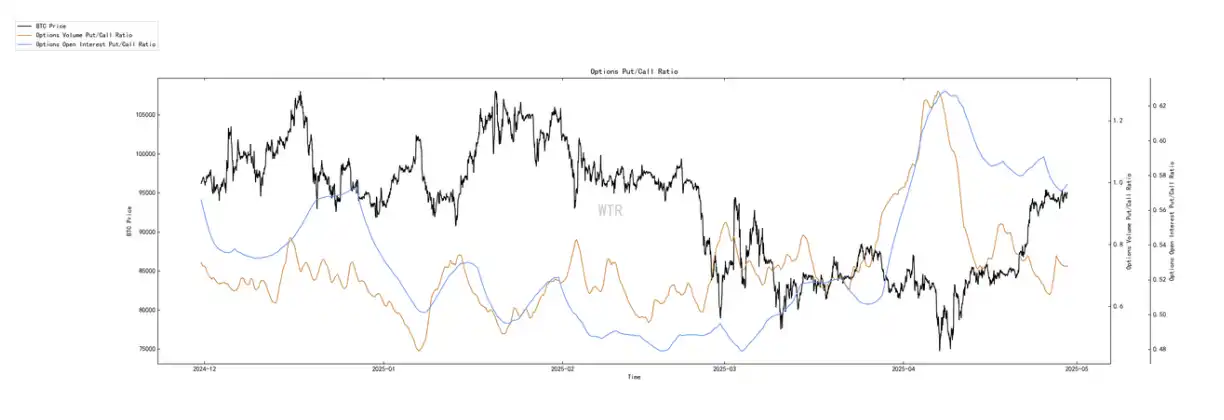
Put option ratio and volume have declined; current put ratio is at a mid-to-high level.
(Below: Derivatives Trading Volume)
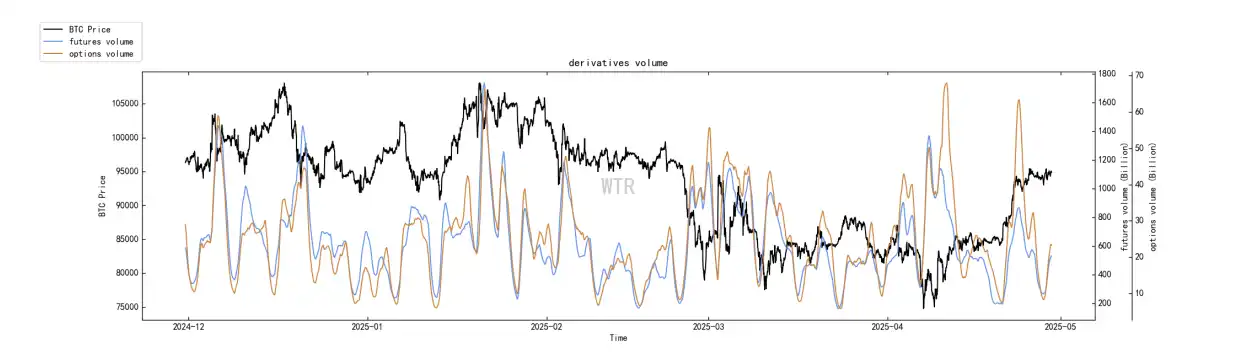
Derivatives trading volume is in the low-to-mid range.
(Below: Implied Volatility of Options)
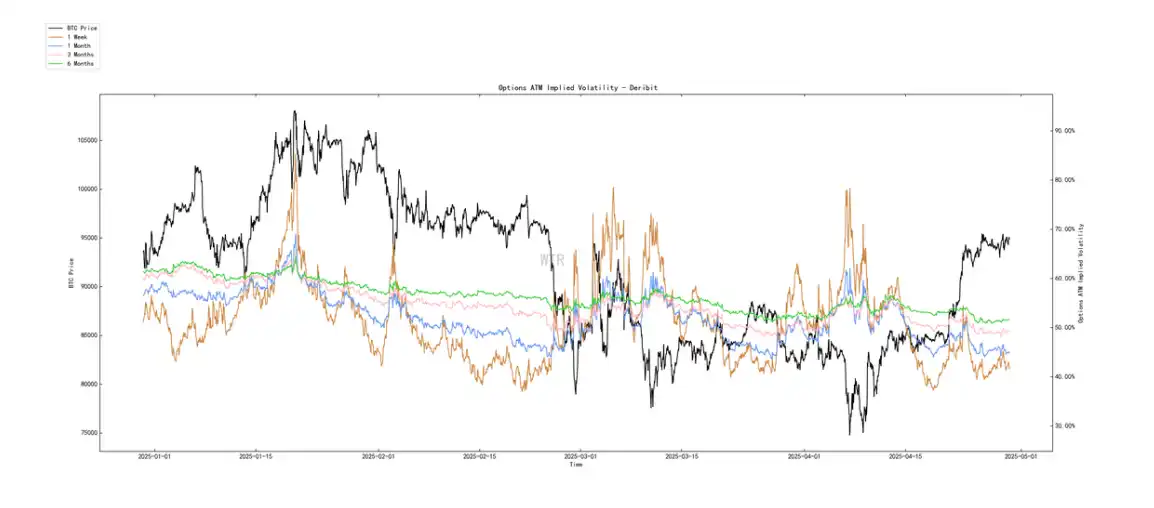
Options implied volatility shows little short-term change. Sentiment rating: Neutral
(Below: Profit/Loss Transfer Volume)
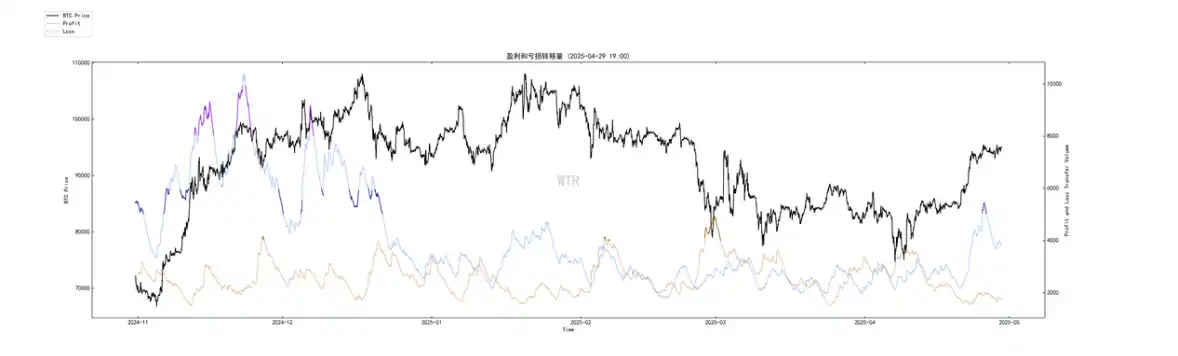
Market rally has led to a noticeable rebound in positive sentiment (blue line), reaching short-term extreme levels. Overall, the market remains in a calm neutral state and has not truly entered a euphoric phase.
(Below: New & Active Addresses)
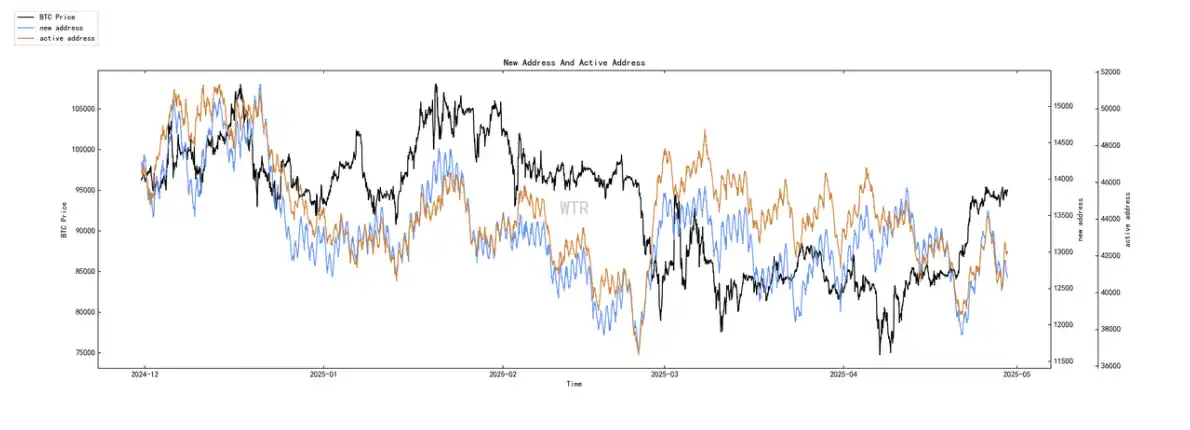
New and active addresses are at mid-to-low levels. Spot and sell pressure structure rating: BTC continues substantial outflows, ETH only slight outflows.
(Below: Ice Orange Exchange Net Position)
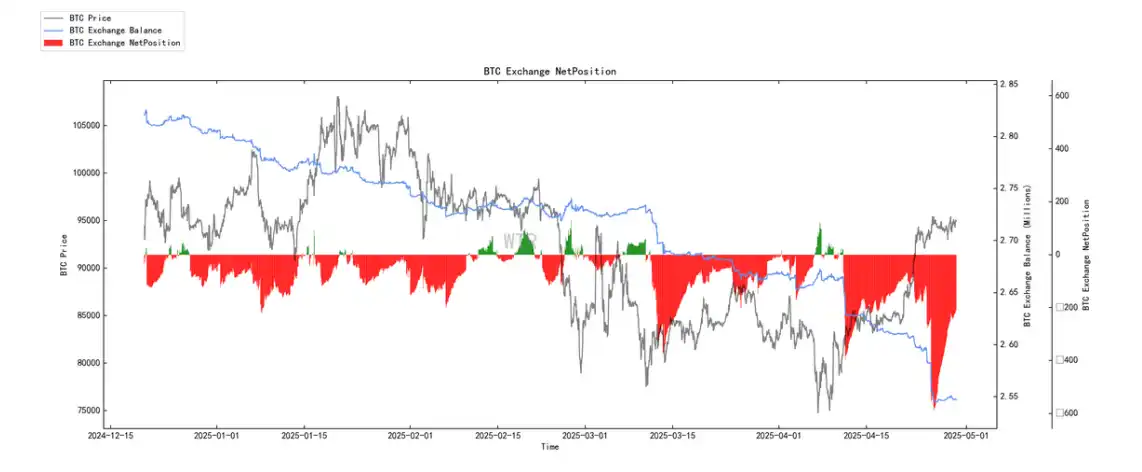
Currently, BTC is experiencing significant outflows.
(Below: Yitai Exchange Net Position)
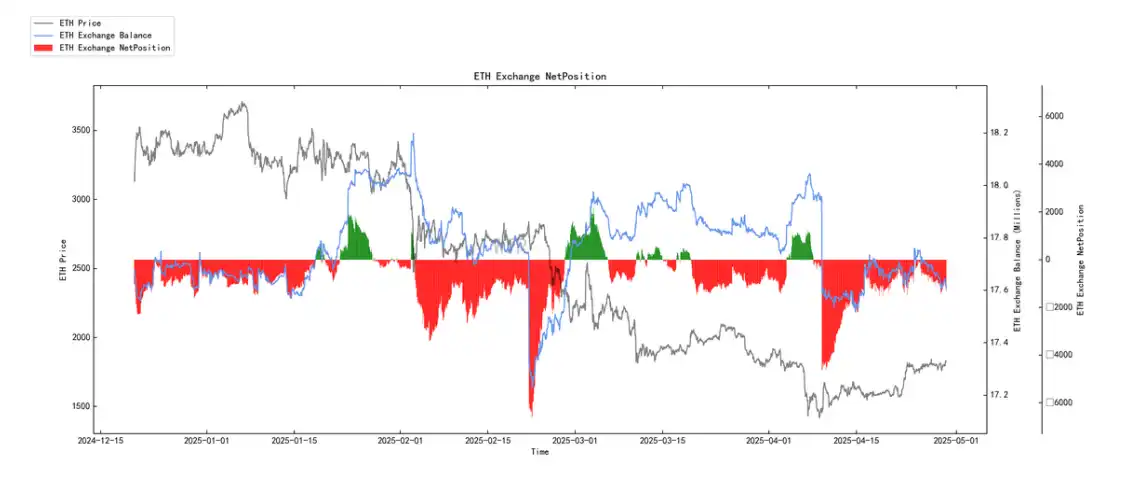
Superficially, ETH net position on exchanges shows continuous outflows. However, upon closer inspection of the blue line, exchange net positions for ETH are nearly equivalent to those seen at the December market top. Short-term ETH on-exchange sell pressure will remain persistent.
(Below: High-Weight Sell Pressure)
No high-weight sell pressure detected.
Purchasing Power Rating: Global purchasing power slightly rebounded; stablecoin purchasing power remained flat.
(Below: Global Purchasing Power Status)
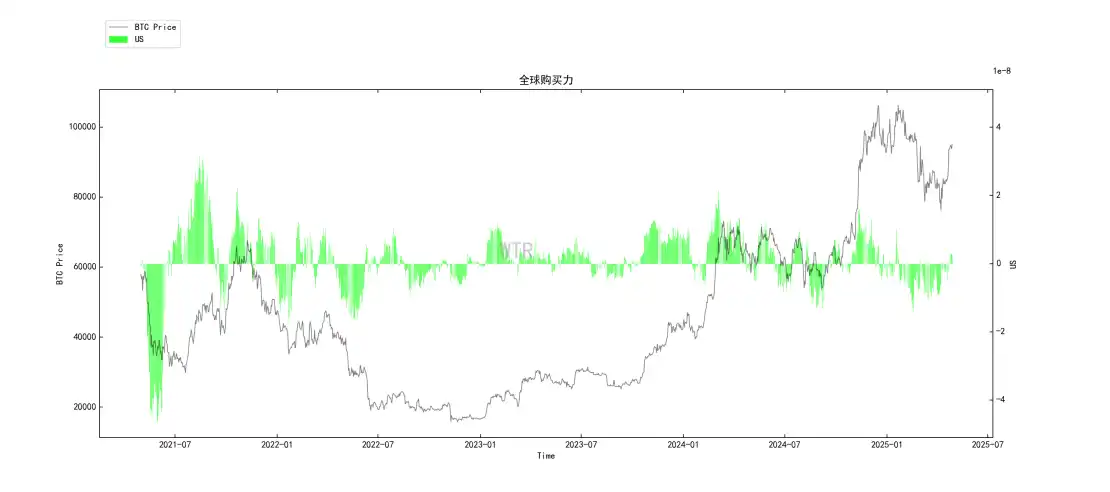
Global purchasing power has slightly rebounded.
(Below: USDT Exchange Net Position)
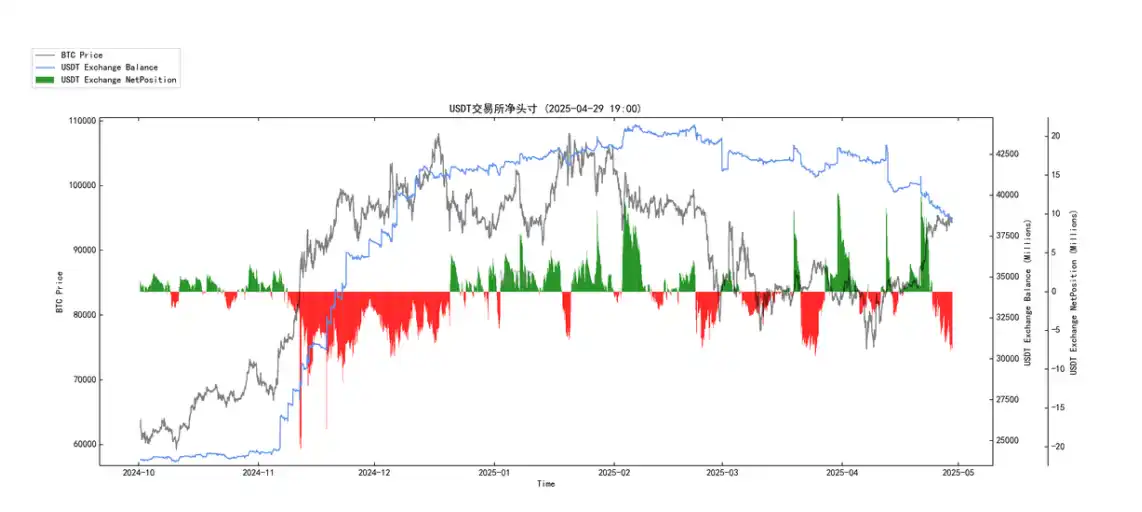
Stablecoin purchasing power remained largely unchanged compared to last week.
Off-Chain Transaction Data Rating: This week's data website experienced downtime; off-chain transaction data unavailable.
This Week Summary:
News Summary:
The market is currently in a unique phase characterized by cautious macro expectations alongside strong internal crypto recovery signals, exhibiting a degree of "de-coupling." Driven by robust ETF capital inflows, improving sentiment, and active short-term traders, the crypto market demonstrates strong internal momentum, seemingly pricing in future rate cuts ahead of time. In the near term, this optimism is likely to persist, but caution is warranted regarding potential volatility from key macro data releases this week. The mid-term market driver hinges on the actual realization of Fed rate cut expectations. Long-term, the structural bull market foundation has become even stronger due to current positive developments.
On-Chain Long-Term Insight:
1. Internal market structure is extremely healthy and robust, marked by strong demand (sustained ETF inflows);
2. Core players are firmly accumulating (whales making large withdrawals);
3. Supply is rapidly locked (illiquid long-term whales surging);
4. Short-term holders have overcome loss pressure.
• Market Assessment:
The market holds upward momentum or supportive capacity in the short term;
Medium-to-long term, the intensifying supply-demand imbalance is laying the groundwork for a potential "supply squeeze" move and more significant upside, with an overall outlook that is positive and optimistic.
On-Chain Mid-Term Exploration:
1. Liquidity undergoing healthy recovery; market momentum gradually rebounding.
2. Purchasing power significantly rebounding; market energy building.
3. Whale holding intent strong; currently supporting price.
4. Current support level at $93,000; existing resistance at $100,000; market in accumulation and adjustment.
5. Outflow trend on exchanges has slowed; currently within a safe adjustment boundary.
• Market Assessment:
Adjustment, Accumulation
The market is currently in a complex structure of adjustment and accumulation, showing signs of liquidity recovery, strong whale buying intent, and overall market stability.
On-Chain Short-Term Observation:
1. Risk coefficient in red zone—derivatives risk is elevated.
2. New active addresses at mid-to-low levels.
3. Market sentiment rating: Neutral.
4. Net exchange positions generally show continued BTC outflows, minimal ETH outflows.
5. Global purchasing power slightly rebounded; stablecoin purchasing power flat.
6. Short-term downside break below 75,000–80,000 has 80% probability of avoidance; short-term upside break above 95,000–100,000 has 50% probability of avoidance.
• Market Assessment:
The market has broken above the short-term holder cost line (~$93K) with significant trading volume concentrated nearby. Positive sentiment and purchasing power have seen minor recovery. Short-term expectation is high likelihood of continued squeeze after current consolidation, with low risk of correction.
Risk Warning: All content above represents market discussion and exploration, not investment advice; please exercise caution and guard against black swan risks.
Submitted by contributor, not representing ChainThink's views.
Disclaimer: Contains third-party opinions, does not constitute financial advice


AI Practical Guide
This column focuses on the real progress of Agents: technological evolution, application implementat
Crypto Weekly
Tracking on-chain movements of the smart money and institutions
Frontier Insights
Spotlight on Frontier, trending projects, and breaking events
Blowup Alert
As the 2026 crypto bear market deepens, exit scams and project blowups are becoming increasingly fre
Regulatory Watch
American Crypto Act – timely interpretations of policies worldwide
Popular Airdrop Tutorial
Selected potential airdrop opportunities to gain big with small investments
FusnChain
FusnChain