ChainThink
Stay ahead, master crypto insights
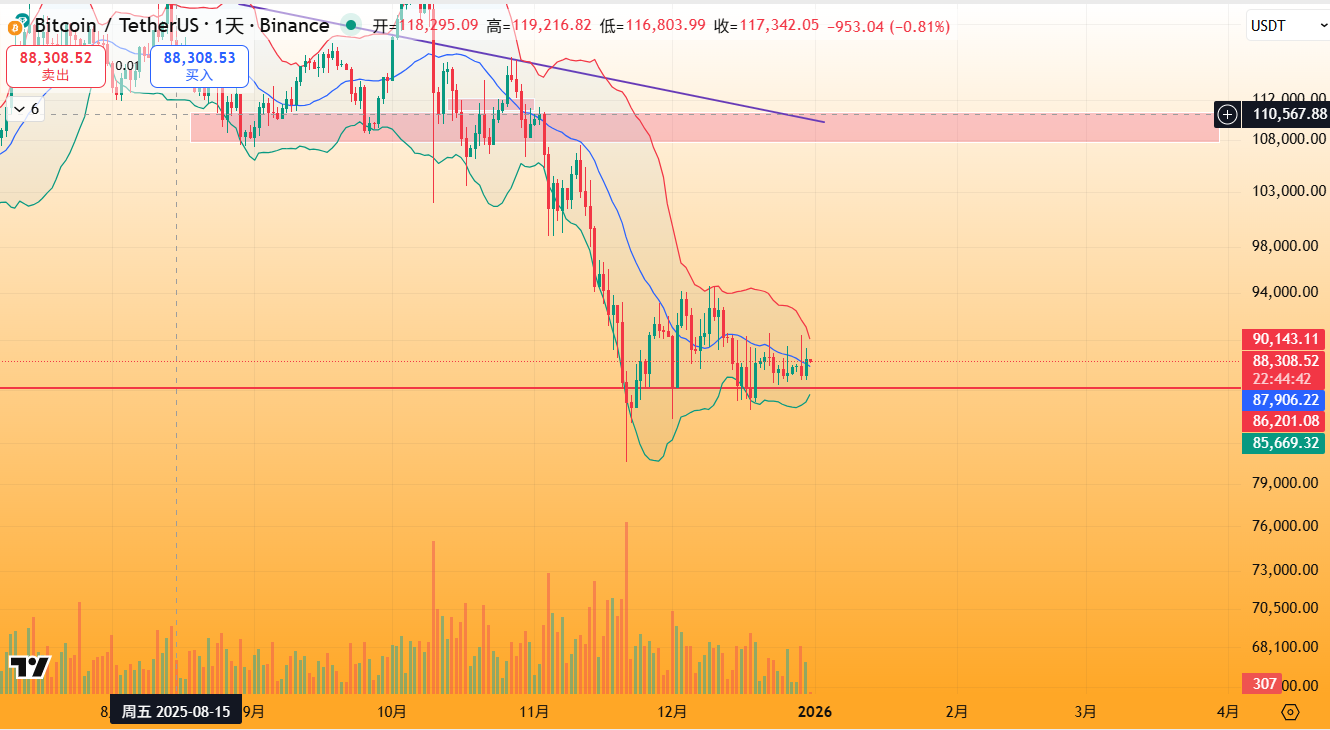
BTC Volatility Signal (Short-term): Bullish Engulfing on Daily Chart but with Shrinking Volume + Converging KDJ, Support around $86,000, Resistance at $90,000
BTC Volatility Signal (Short-term): Bullish Engulfing on Daily Chart but with Shrinking Volume + Converging KDJ, Support around $86,000, Resistance at $90,000
2025-12-31 09:16
ChainThink report: On December 31, AI-powered technical analysis indicates that BTC has once again exhibited a false breakout pattern. After breaking above the Bollinger Band middle band on the 29th, price reversed sharply downward and broke below key support. Given the current market environment remains within a consolidation and ranging phase, levels are prone to rapid invalidation; thus, heightened observation is required to avoid chasing momentum or panic selling. Currently, the Bollinger Bands are contracting with narrowing bandwidth, while the KDJ indicator shows convergence, signaling reduced volatility and the absence of a clear directional trend. Although yesterday's daily candle formed a bullish engulfing pattern, volume contraction persists, indicating insufficient expansion in long-side momentum. The immediate resistance level remains at $90,000, which has failed to hold for three consecutive pinbar attempts. Key support is located near the lower Bollinger Band at approximately $86,000.
Support and resistance levels are only considered valid upon confirmed breakouts or breakdowns sustained over two consecutive daily timeframes, signaling a shift from range-bound to directional movement. A confirmed breakout above $90,000 would indicate a transition from consolidation to a bullish bias. Conversely, a confirmed breakdown below $86,000 would invalidate the ranging structure and signal a bearish shift. (AI analysis, not investment advice, valid for 2–6 days)
Disclaimer: Contains third-party opinions, does not constitute financial advice


10·11 Crypto Mass Liquidation
This column conducts an in-depth review of the entire 10·11 crypto liquidation incident, which saw n
Blowup Alert
As the 2026 crypto bear market deepens, exit scams and project blowups are becoming increasingly fre
Popular Airdrop Tutorial
Selected potential airdrop opportunities to gain big with small investments
Frontier Insights
Spotlight on Frontier, trending projects, and breaking events
Regulatory Watch
American Crypto Act – timely interpretations of policies worldwide
Crypto Weekly
Tracking on-chain movements of the smart money and institutions