Are Prediction Markets a Money Machine? Deep Dive into Their Profit Models
Are Prediction Markets a Money Machine? Deep Dive into Their Profit Models
When discussing prediction markets in the past, people cared more about accuracy, trading volume, and whether they could become a new information market. But when prediction markets are viewed as a business, the core question shifts: what is the profit model of a prediction market?
In the commercial world, high trading volume does not equate to platform profitability. A market can have massive visibility and users frequently buying and selling, but if most trades fail to generate fee-eligible activity—or if engagement is sustained solely through subsidies and points—then trading volume becomes merely an attractive metric, not a healthy revenue stream.
For prediction markets, the true test of commercial viability isn't "how many markets were launched" or "how viral a particular event became," but whether the platform can seamlessly connect three critical elements:
Generating genuine trading impulse;
Maintaining sufficient depth in the order book for liquidity;
Converting active taker demand into Fees (transaction fees).
This is why the business model of prediction markets is far from simple "charging a tax upon opening." On the surface, it's just a series of YES/NO bets, but the real foundation of platform revenue lies in underlying transaction structures, liquidity mechanisms, fee asymmetries, and user behavior.
Especially after Polymarket began systematically introducing Taker Fees, the narrative around prediction markets has shifted from "information tool" to "revenue validation."
This article dissects the foundational mechanics of prediction markets from a commercial perspective:
How do prediction market platforms make money?
Why does the Maker/Taker game theory determine a platform’s survival?
What are the essential differences in fee design across leading platforms such as @Polymarket, Kalshi, @opinionlabsxyz, and @predictdotfun?
Why is the highest-volume segment often not the most profitable?
💡 Core Insight: Prediction markets don’t sell answers—they sell divergence.
The closer the price is to 50/50, the greater the market divergence, the stronger the trading impulse, and the easier it is for the platform to convert active trades into fee income. The closer the price is to 0 or 100, the more certain the outcome, and while informational value remains, the corresponding fee weight drops significantly.
Thus, the true commercial moat of prediction markets isn't turning "events" into markets—it's transforming "divergence" into transactions, and then steadily converting those transactions into sustainable revenue.
One: How Do Prediction Markets Make Money? Not by Launching Markets, But by Converting Divergence into Fees
To unpack the cash flow of prediction markets, we must first clarify the four core drivers of revenue. These interlock to form a closed loop from traffic to monetization.
1️⃣ Transaction Fees – Direct Revenue Source
Most prediction markets charge the active party—the Taker—who consumes liquidity. In contrast, Makers provide liquidity.
This means not every trade generates revenue for the platform. The trades that truly contribute fees are typically those where users are willing to execute immediately, paying a premium for speed and certainty.
2️⃣ Liquidity – Foundation for Sustained Trading
The hardest part for prediction markets isn’t launching markets; it’s ensuring deep order books.
If no orders are posted on a market, users cannot buy or sell, rendering even the most talked-about event unable to form an effective price.
Thus, many platforms reduce Maker costs or offer incentives to Makers.
This isn’t a direct revenue source, but it determines whether transaction fees can exist sustainably.
No liquidity means no continuous trading, and thus no stable fee income.
3️⃣ Information Value – Mindshare Positioning
A key difference between prediction markets and ordinary trading platforms is that prediction markets also produce information.
Once a market achieves sufficient trading volume and liquidity, its price becomes a probabilistic signal. Media outlets cite it, KOLs interpret it, traders monitor it, and general users use it to gauge market sentiment.
While this doesn’t directly generate fees, it brings attention, user mindshare, and external amplification. Over time, these information assets feed back into increased trading demand.
4️⃣ User Operations & Discount Systems – Converting Activity into Revenue
Beyond base transaction fees, different platforms use discounts, referrals, events, points, and rebates to increase trading frequency. These measures may not directly generate revenue, but they shape long-term monetization capacity. For example, Opinion offers user discounts, transaction discounts, and referral discounts; Predict.fun uses a simpler base fee and discount mechanism; Polymarket focuses on differentiated rates across segments and Maker rebates. Discounts and incentives are not pure subsidies—they involve sacrificing part of profit to secure user retention, eventually converting activity into revenue.
Two: Cross-Platform Comparison of Fee Structures in Leading Prediction Markets
Examining the fee designs of major prediction markets reveals a highly convergent strategic direction: incentivize order placement to provide liquidity, and convert active execution into revenue. However, tactical implementations differ due to varying positioning.
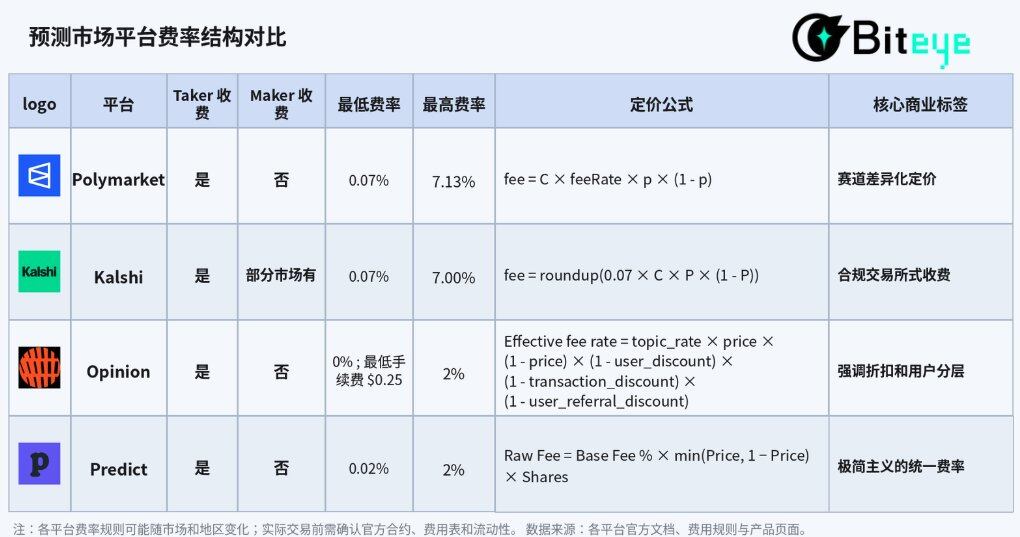
1️⃣ Polymarket: Granular Pricing by Segment
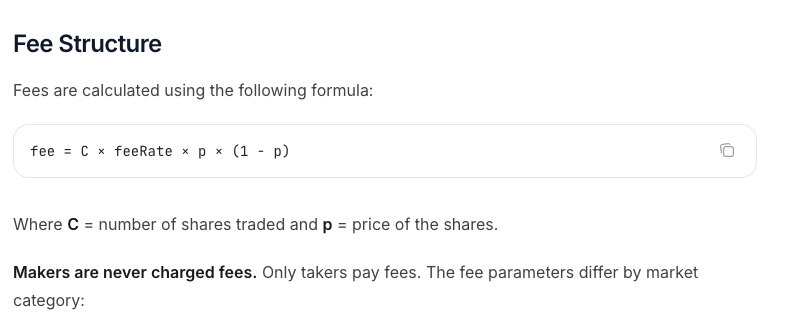
Polymarket’s Taker fee logic combines “segment differentiation” with “divergence-based pricing” to an extreme degree. Its official core formula is:
fee = C × feeRate × p × (1 - p)
Where C is the number of shares traded, p is the price, and feeRate is determined by the market segment.
This mechanism hinges on two key variables:
Segment Granularity: Based on verified rate tiers, Crypto has a feeRate of 0.07, Sports 0.03, Politics/Finance/Tech 0.04, Culture/Weather 0.05, and some Geopolitics markets at 0. Thus, Polymarket does not apply uniform fees—it uses differentiated rates based on trading frequency, sensitivity, and user willingness to pay across segments.
Divergence-Based Pricing: Perfectly aligns with the mathematical curve of p × (1 - p). The closer the price is to 50/50 (maximum divergence), the higher the fee; the closer to 0 or 100 (high certainty), the lower the fee.
https://docs.polymarket.com/trading/fees
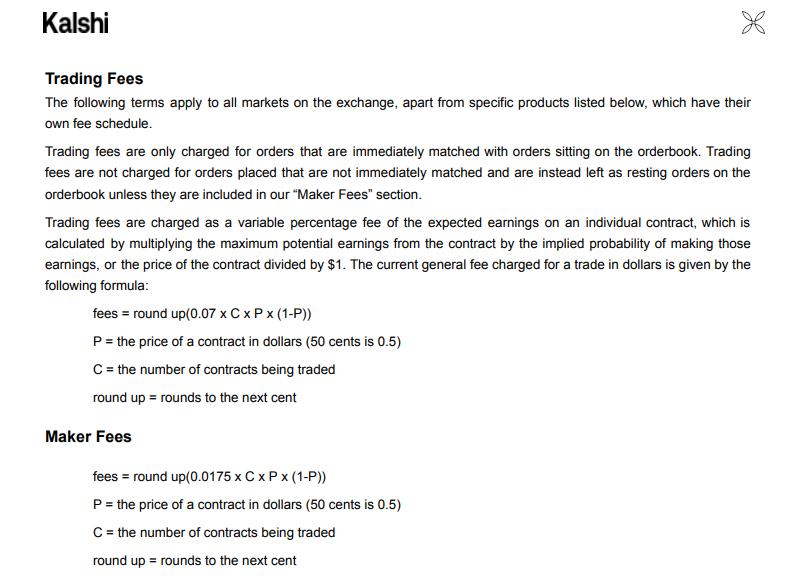
2️⃣ Kalshi: Closer to a Regulated Exchange Model
Kalshi’s fee structure operates within a compliance framework resembling traditional financial derivatives exchanges. Its standard Taker fee formula also ties to price divergence:
fee = round up(0.07 × C × P × (1 - P))
Where C is the number of contracts and P is the contract price. Fees are rounded up to the nearest cent. This structure closely mirrors Polymarket’s C × feeRate × p × (1-p).
Kalshi’s fee structure shares similarities with Polymarket: transaction fees correlate with contract price—higher near 50¢, lower near 1¢/99¢. Kalshi’s fee schedule shows that a Taker fee for 100 contracts ranges roughly between $0.07 and $1.75.
However, a key distinction is that Kalshi charges Maker fees on certain markets, but only when orders actually execute—canceled orders incur no fee. This indicates Kalshi’s fee model is closer to regulated exchanges: not simply free Maker access forever, but complex bilateral fee rules tailored per market.
https://kalshi.com/docs/kalshi-fee-schedule.pdf
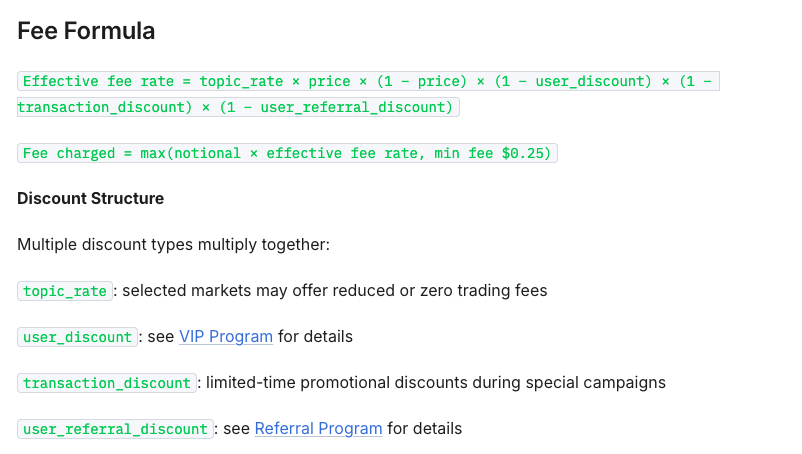
3️⃣ Opinion: Emphasis on Discounts and User Segmentation
Opinion introduces an extremely complex “multi-dimensional discount system.” Its effective fee rate formula is:
Effective fee rate = topic_rate × price × (1 − price) × (1 − user_discount) × (1 − transaction_discount) × (1 − user_referral_discount)
Thus, Opinion’s fees depend not only on market price and topic_rate but also on user discounts, transaction discounts, and referral discounts.
Opinion also sets a $5 minimum order and a $0.25 minimum fee to avoid excessively low fees from small trades.
This reveals that Opinion’s fee design leans heavily into user operations:
topic_rate distinguishes between market types
user_discount enables user tiering
Therefore, unlike Polymarket’s “segment-based pricing,” Opinion treats fees as an operational lever: using discount systems to guide trading, retention, and acquisition, while offering free Makers to lower entry barriers and maintain liquidity.
https://docs.opinion.trade/trade-on-opinion.trade/fees
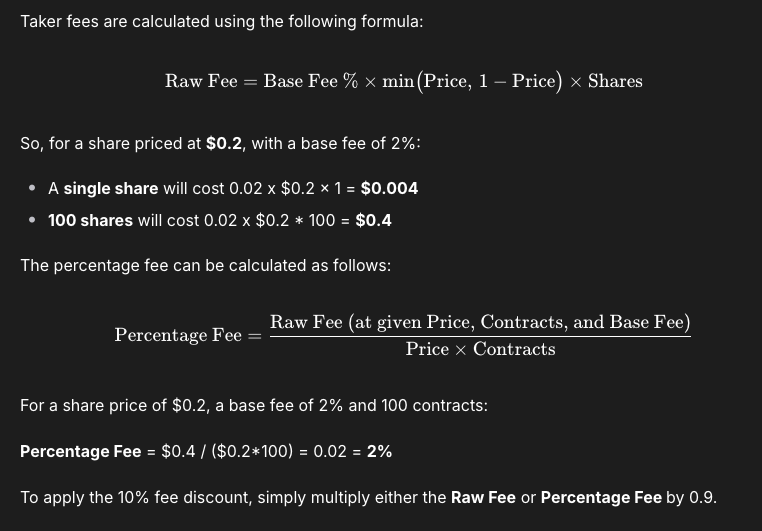
4️⃣ Predict.fun: Minimalist Unified Rate
Predict.fun’s fee structure is relatively simpler, designed to lower user cognitive load.
According to its current public specification, the fee calculation formula is:
Raw Fee = Base Fee % × min(Price, 1 − Price) × Shares
Base Fee is currently 2%. The actual rate varies with price: fixed at 2% below 50%, and decreases as price approaches 1.
Additionally, Predict.fun supports fee discounts, further reducing fees post-discount.
This design is more intuitive: users don’t need to identify which side of the market they’re on—only focus on the price itself to understand fee changes.
https://docs.predict.fun/the-basics/predict-fees-and-limits#limits
It’s evident that all prediction market platforms share one goal: converting active execution into revenue.
This confirms that monetization in prediction markets isn’t a single path. They ultimately answer one question: are users willing to pay for trading?
Three: Deep Dive into Polymarket – Trading Volume ≠ Real Revenue
Although various platforms experiment with different models, Polymarket remains the best benchmark for assessing real monetization efficiency in prediction markets.
Two main reasons:
Its fee path is clearest: from Crypto pilot to Sports expansion, then full-scale charging across more categories
Its data is more comprehensive: official feeRates and 7D/30D Fees allow deeper revenue structure analysis
Thus, we’ll use Polymarket as a case study to answer a more specific question: is the highest-volume segment also the most profitable?
3.1 From Free to Paid: Polymarket’s Commercialization Timeline
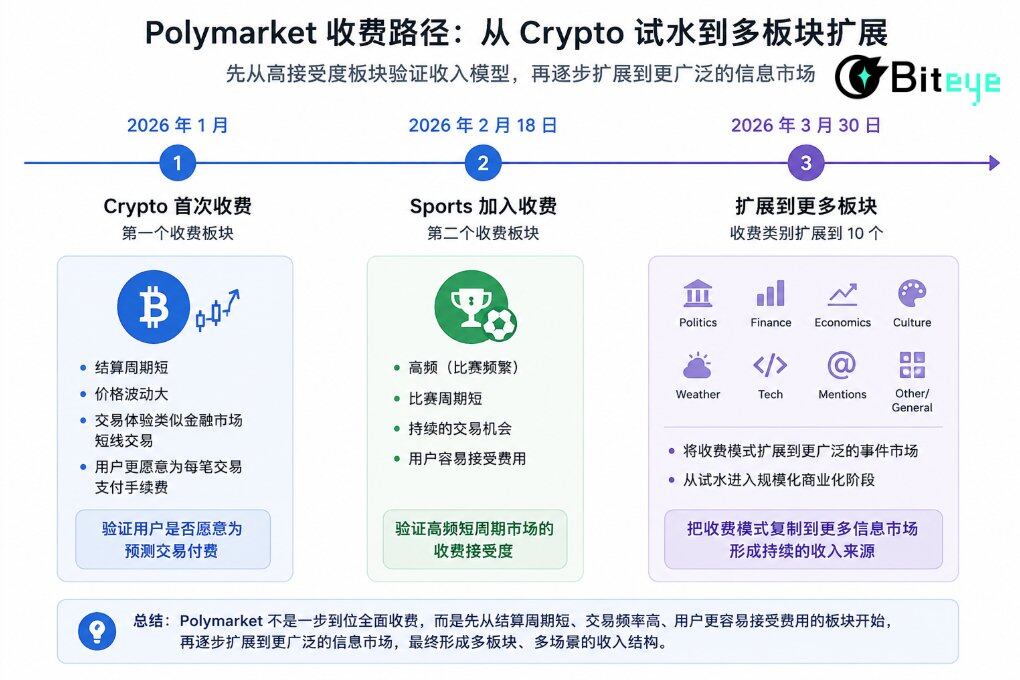
January 2026: Crypto becomes the first paid segment
Polymarket re-entered U.S. users and introduced Taker Fees first in the Crypto segment. Crypto markets have short settlement cycles, high volatility, and trading behaviors similar to short-term secondary markets. Users prioritize speed of realization over friction cost—making it an ideal testing ground for fees.
February 18, 2026: Sports becomes the second paid segment
Shortly thereafter, on February 18, 2026, the Sports segment became the second paid category. Sports markets naturally feature high-frequency, short-cycle characteristics, enabling continuous trading scenarios—making Sports a logical extension of fee collection.
Thus, Polymarket’s initial charging of Crypto and Sports was a strategic move to validate its revenue model on segments with higher user acceptance.
March 30, 2026: Expansion to More Segments
On March 30, 2026, Polymarket extended Taker Fees to Politics, Finance, Economics, Culture, Weather, Tech, Mentions, and Other/General categories—expanding to 10 total segments.
After full monetization, Polymarket didn’t apply uniform fees across all segments but adopted a finer-grained rate structure—a pivotal moment in its commercialization. Polymarket began extending its fee model across broader markets.
The results of full monetization were striking. According to latest data, Polymarket demonstrated immense revenue-generating power: 7D Fees reached $9.27M, and 30D Fees hit $36.3M. Its 7-day revenue now ranks among the top six in the entire crypto ecosystem, officially joining the elite tier of revenue-driven projects.
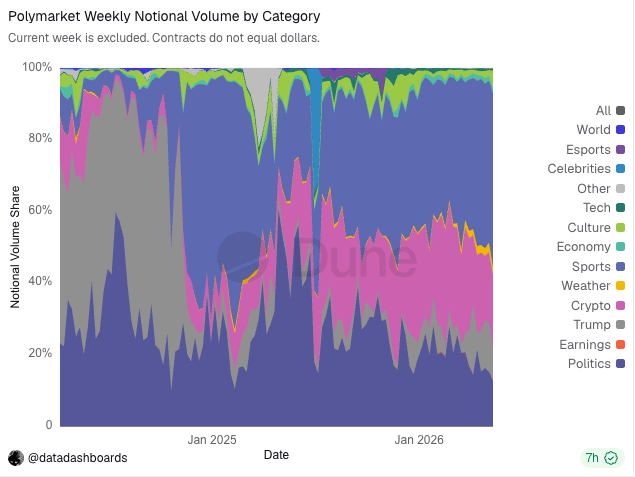
3.2 Core Segment Breakdown: Price Distribution Analysis
To estimate Polymarket’s real revenue per segment, we analyzed transaction data from 2021 to February 2026, estimating fees for five major segments.
From market order ratio, the five segments show clear differences:
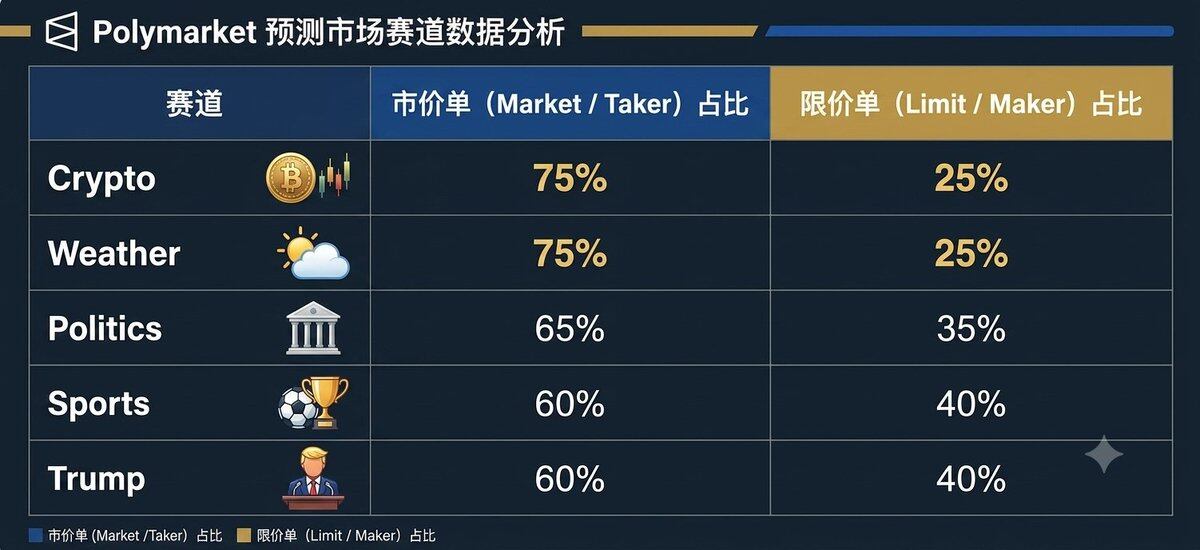
Crypto has the highest Market order ratio at 75%, consistent with the volatile nature of crypto assets—users prefer immediate market orders to lock in gains or losses. Similarly, Weather markets, driven by real-time meteorological events, emphasize rapid response.
Second, fee levels strongly depend on the price range of the trade.
Reason: not all trades entering the fee-eligible pool generate equal fees. Polymarket’s fees relate to p × (1 - p)—the closer the price is to 50/50 (highest divergence), the higher the fee weight; the closer to 0% or 100% (certainty), the lower the fee weight.
From the five major segments’ data, most trades concentrate in the 30–50 range, especially 40–50:
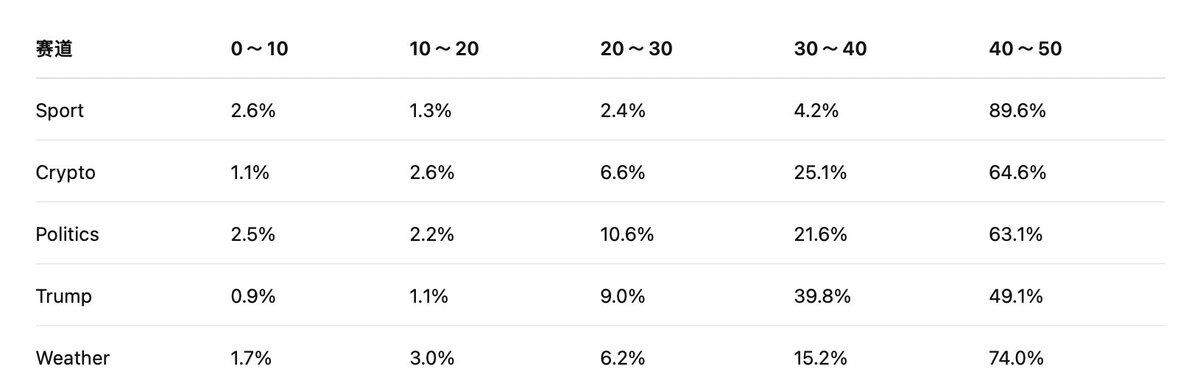
This data shows that Polymarket’s primary trading activity occurs not in already-determined outcomes, but in markets still exhibiting significant divergence.
3.3 Revenue Estimation: Who Is the Profit Cow?
We estimate Polymarket’s fee income across five segments by combining each segment’s Market turnover, corresponding feeRate, and p × (1-p) weights across price ranges. We also account for post-fee adoption: some fee-sensitive users shift from Taker to Limit orders—especially those doing end-of-day trades, low-odds arbitrage, or frequent short-term trading—who now carefully evaluate ROI.
Thus, we apply a more conservative assumption: a 20% reduction in Market order volume post-fee implementation.
The adjusted formula becomes:
Adjusted Fee Estimate ≈ Market Turnover × 80% × feeRate × (1 - p)
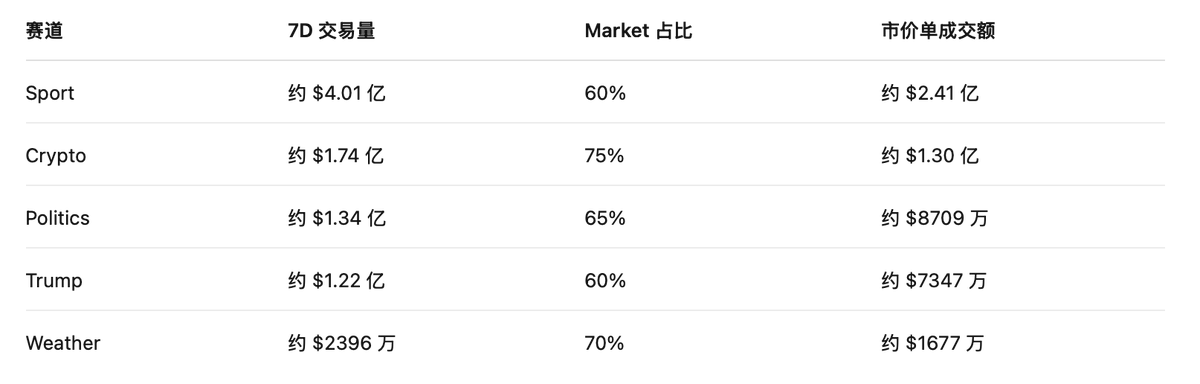
Using 7D total volume and segment-specific volume ratios, we estimate 7D Market order turnover for the five major segments.
Having calculated each segment’s Market order turnover, we now combine feeRates and price-weighted p × (1-p) factors to estimate fees. To ensure robustness, we use midpoints of each price interval as approximations:
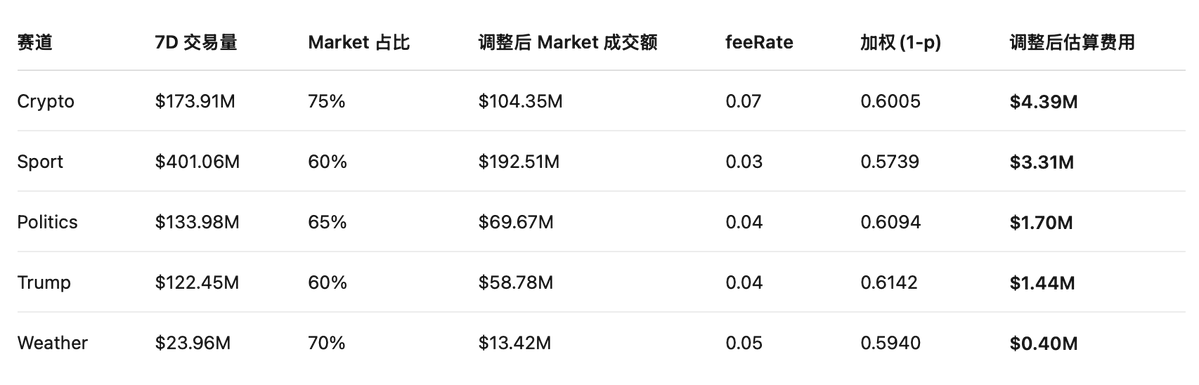
(Note: Due to data sampling lags, historical order type distribution, and dynamic market changes, this model aims to reflect relative contribution proportions. Total estimated fees may deviate slightly from system-reported totals.)
What do the data reveal?
1️⃣ Crypto is currently the top profit contributor, with 7D estimated fees of ~$4.39M—the “profit cow.”
This is counterintuitive: from volume, Sport is the largest segment, with 7D volume ~$401M, surpassing Crypto’s ~$174M. Yet, Crypto leads in fees, due to two factors:
Higher Market Order Ratio: Market orders account for ~75%, significantly above Sport’s 60%. Since Polymarket primarily charges Market orders, Crypto captures more fee-eligible trades.
Highest feeRate: feeRate is 0.07 vs. Sport’s 0.03. Even with identical Market order volumes, Crypto generates substantially higher fees per unit of turnover.
2️⃣ Sport is the second-largest fee source, with 7D estimated fees of ~$3.31M—the “volume base layer.”
Sport’s strength lies in sheer volume: its 7D volume (~$401M) ranks first among the five segments. But its weakness is clear: lowest feeRate at 0.03.
3️⃣ Politics and Trump, combined as political markets, yield 7D estimated fees of ~$3.14M—very close to Sport’s level—acting as pulse-driven traffic funnels.
Political markets are highly event-driven. Unlike Sports with daily games or Crypto with constant price swings, political markets don’t sustain steady activity. But during elections, polls, policy changes, or candidate statements, they see sudden surges in trading—making them highly lucrative during hot cycles despite irregular rhythms.
4️⃣ Weather’s 7D estimated fees are ~$400K—the lowest among the five segments.
Thus, Polymarket’s revenue structure can be summarized simply: Crypto drives platform revenue, Sport sustains trading volume, Politics/Trump fuels event-driven spikes for user acquisition.
Four: Four Final Judgments on Prediction Market Segments from Polymarket’s Lens
Polymarket’s successful closed-loop model offers transformative insights for the entire prediction market sector:
1️⃣ Comprehensive Metric Shift
Previously, evaluation focused on trading volume and trending topics. In the commercial era, success metrics will fully shift to: real Fees, Taker ratio, order book depth, and bid-ask spread. Trades created purely via internal rotation (“left-hand-to-right-hand”) will struggle to sustain under fee mechanisms.
2️⃣ Different Event Types, Different Revenue Roles
Future prediction market platforms won’t rely on a single market type to dominate. Instead, they’ll evolve toward specialized division of labor.
Crypto markets resemble financial trading: fast price changes, short feedback loops, and user sensitivity to execution speed—making them ideal for high-efficiency revenue generation.
Sports markets function like steady cash flow: frequent events, clear outcomes, and continuous trading scenarios—ideal for sustaining daily volume.
Politics/Trump markets are event-driven: not consistently active, but capable of explosive volume during election cycles, polling shifts, or policy announcements—making them high-impact in peak periods.
Weather markets demonstrate that even modest-scale, standardized events with clear outcomes can carve out dedicated trading niches.
3️⃣ Fee Mechanisms Reverse-Engineer Market Quality
In the free phase, platforms could launch countless markets. After charging, users and market makers begin scrutinizing costs—fee mechanisms effectively screen market quality.
A good prediction market must satisfy multiple conditions simultaneously:
Clear outcome for settlement
Frequent information updates driving price changes
Sufficient divergence to motivate trading
Strong liquidity encouraging active execution
Resistance to manipulation
4️⃣ The Moat Lies in “Sustainable Pricing Power”
Launching a YES/NO market is easy. Harder is maintaining continuous order placement, execution, price updates, and risk-taking. Only when a market has sufficient depth and trading frequency does its price gain reference value—and only then can the platform generate revenue.
Thus, the true barrier in prediction markets isn’t “who spots trends fastest”—it’s: transform trends into tradable markets → sustain long-term liquidity → make prices signals externally trusted and cited.
Five: Final Thoughts
Projects capable of grand narratives are legion—but those that turn narratives into tangible, hard-earned revenue are rare.
Polymarket was once the most glamorous traffic magnet in the space. Now, having transitioned from “traffic story” to “systematic revenue capture,” it aims to prove one thing to the industry:
The ultimate value of prediction markets extends far beyond “how accurate they predict the future.” It lies in their ability to transform the uncertainty of the real world into a standardized, high-frequency, and continuously profitable super-market.
In the past, prediction markets proved they could capture massive attention. Today, they are proving they are a uniquely powerful business model.
1 Calculation Method: Extract ratio of market vs. limit orders per segment, estimate p × (1 - p) impact across price ranges, then combine with respective feeRates to approximate each segment’s fee contribution.
Original Authors: Changan, Amelia, Biteye Content Team
Disclaimer: Contains third-party opinions, does not constitute financial advice
NVIDIA attracts $85 billion in investor demand during massive bond issuance
06-16
Ethereum surges over 10% in 24 hours, currently priced at $1,841.31
06-16Amazon announces a multi-billion dollar investment in Missouri to build a data center campus, expected to create over 400 long-term positions
06-16Binance Platform's SpaceX Perpetual Contract Trading Volume Surpasses $9 Billion, Capturing Over 60% Market Share
06-16Binance platform XLM/USDT short-term spike down to $0.17, now recovered to $0.225
06-16
Trump: The Strait of Hormuz has been fully reopened as of Friday, and all agreements have been signed
06-16SlowMist: Aztec Connect Contract Hacked for $2.19 Million Due to ZK-Rollup L1/L2 State Boundary Vulnerability
06-15
